Investor Education
Ranking Asset Classes by Historical Returns (1985-2020)
Historical Returns by Asset Class (1985-2020)
Mirror, mirror, on the wall, is there one asset class to rule them all?
From stocks to bonds to alternatives, investors can choose from a wide variety of investment types. The choices can be overwhelming—leaving people to wonder if there’s one investment that consistently outperforms, or if there’s a predictable pattern of performance.
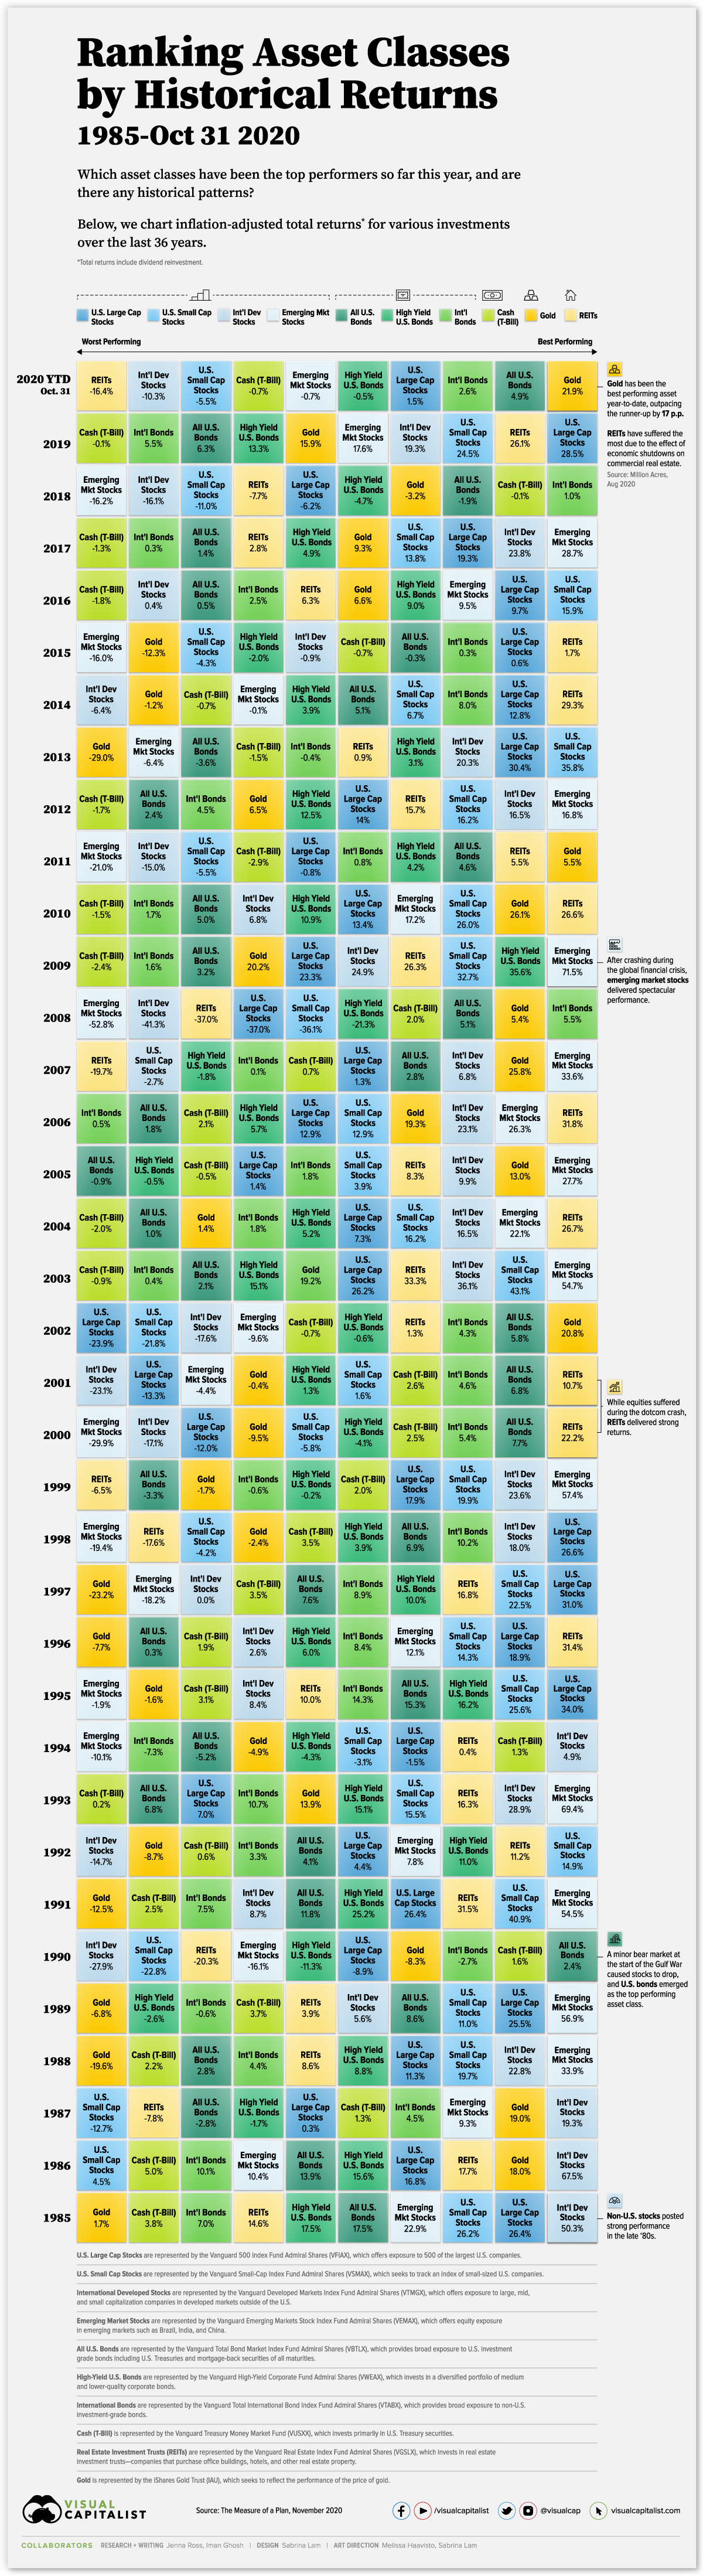
This graphic, which is inspired by and uses data from The Measure of a Plan, shows historical returns by asset class for the last 36 years.
Asset Class Returns by Year
This analysis includes assets of various types, geographies, and risk levels. It uses real total returns, meaning that they account for inflation and the reinvestment of dividends.
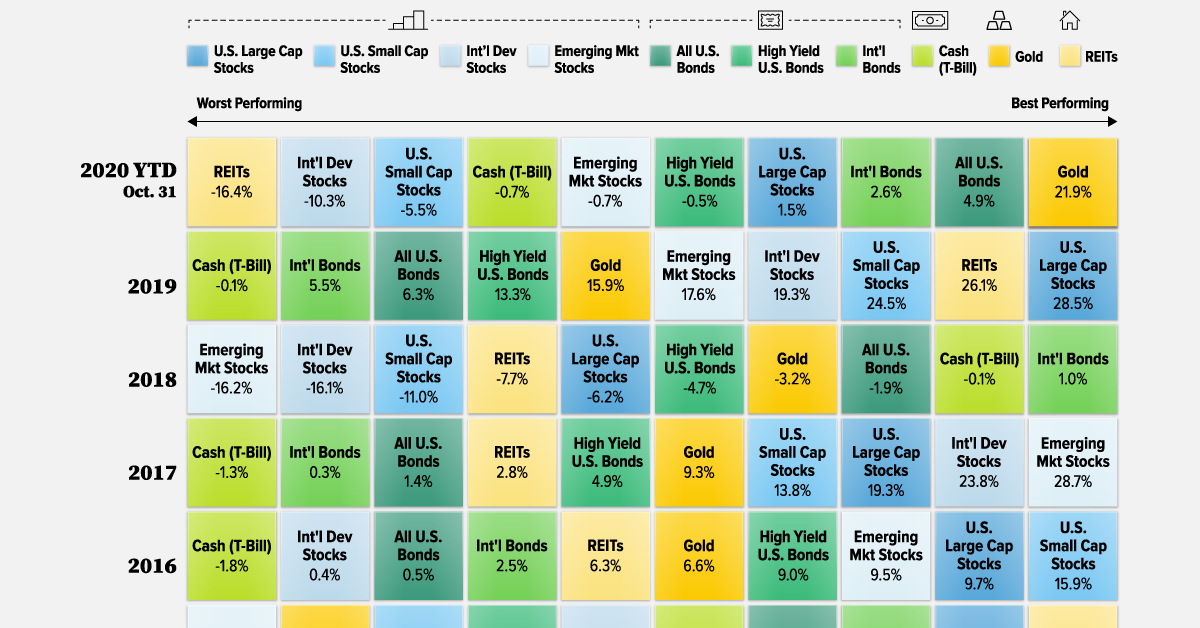
Here’s how the data breaks down, this time organized by asset class rather than year:
| U.S. Large Cap Stocks | U.S. Small Cap Stocks | Int'l Dev Stocks | Emerging Stocks | All U.S. Bonds | High-Yield U.S. Bonds | Int'l Bonds | Cash (T-Bill) | REIT | Gold | |
|---|---|---|---|---|---|---|---|---|---|---|
| Ticker | VFIAX | VSMAX | VTMGX | VEMAX | VBTLX | VWEAX | VTABX | VUSXX | VGSLX | IAU |
| 2020* | 1.5% | -5.5% | -10.3% | -0.7% | 4.9% | -0.5% | 2.6% | -0.7% | -16.4% | 21.9% |
| 2019 | 28.5% | 24.5% | 19.3% | 17.6% | 6.3% | 13.3% | 5.5% | -0.1% | 26.1% | 15.9% |
| 2018 | -6.2% | -11.0% | -16.1% | -16.2% | -1.9% | -4.7% | 1.0% | -0.1% | -7.7% | -3.2% |
| 2017 | 19.3% | 13.8% | 23.8% | 28.7% | 1.4% | 4.9% | 0.3% | -1.3% | 2.8% | 9.3% |
| 2016 | 9.7% | 15.9% | 0.4% | 9.5% | 0.5% | 9.0% | 2.5% | -1.8% | 6.3% | 6.6% |
| 2015 | 0.6% | -4.3% | -0.9% | -16.0% | -0.3% | -2.0% | 0.3% | -0.7% | 1.6% | -12.3% |
| 2014 | 12.8% | 6.7% | -6.4% | -0.2% | 5.1% | 3.9% | 8.0% | -0.7% | 29.3% | -1.2% |
| 2013 | 30.4% | 35.8% | 20.3% | -6.4% | -3.6% | 3.1% | -0.4% | -1.5% | 0.9% | -29.0% |
| 2012 | 14.0% | 16.2% | 16.5% | 16.8% | 2.4% | 12.5% | 4.5% | -1.7% | 15.7% | 6.5% |
| 2011 | -0.9% | -5.5% | -15.0% | -21.0% | 4.6% | 4.2% | 0.8% | -2.9% | 5.5% | 5.5% |
| 2010 | 13.4% | 26.0% | 6.8% | 17.2% | 5.0% | 10.9% | 1.7% | -1.5% | 26.6% | 26.0% |
| 2009 | 23.3% | 32.7% | 24.9% | 71.5% | 3.2% | 35.6% | 1.6% | -2.4% | 26.3% | 20.2% |
| 2008 | -37.0% | -36.1% | -41.3% | -52.8% | 5.1% | -21.3% | 5.5% | 2.0% | -37.0% | 5.4% |
| 2007 | 1.3% | -2.7% | 6.8% | 33.6% | 2.8% | -1.8% | 0.1% | 0.7% | -19.7% | 25.8% |
| 2006 | 12.9% | 12.9% | 23.1% | 26.3% | 1.8% | 5.7% | 0.5% | 2.1% | 31.8% | 19.3% |
| 2005 | 1.4% | 3.9% | 9.8% | 27.7% | -0.9% | -0.5% | 1.8% | -0.5% | 8.3% | 13.0% |
| 2004 | 7.3% | 16.2% | 16.5% | 22.1% | 1.0% | 5.2% | 1.8% | -2.0% | 26.7% | 1.4% |
| 2003 | 26.2% | 43.1% | 36.1% | 54.7% | 2.1% | 15.1% | 0.4% | -0.9% | 33.3% | 19.2% |
| 2002 | -23.9% | -21.8% | -17.6% | -9.6% | 5.8% | -0.6% | 4.2% | -0.7% | 1.3% | 20.8% |
| 2001 | -13.3% | 1.6% | -23.1% | -4.4% | 6.8% | 1.3% | 4.6% | 2.6% | 10.7% | -0.4% |
| 2000 | -12.0% | -5.8% | -17.1% | -29.9% | 7.7% | -4.1% | 5.4% | 2.5% | 22.2% | -9.6% |
| 1999 | 17.9% | 19.9% | 23.6% | 57.3% | -3.4% | -0.2% | -0.6% | 2.0% | -6.5% | -1.7% |
| 1998 | 26.6% | -4.2% | 18.0% | -19.4% | 6.9% | 3.9% | 10.2% | 3.5% | -17.7% | -2.4% |
| 1997 | 31.0% | 22.5% | 0.0% | -18.2% | 7.6% | 10.0% | 8.9% | 3.5% | 16.8% | -23.2% |
| 1996 | 18.9% | 14.3% | 2.6% | 12.1% | 0.3% | 6.0% | 8.3% | 1.9% | 31.4% | -7.7% |
| 1995 | 34.0% | 25.6% | 8.4% | -1.9% | 15.3% | 16.2% | 14.3% | 3.1% | 10.0% | -1.7% |
| 1994 | -1.5% | -3.1% | 4.9% | -10.1% | -5.2% | -4.3% | -7.3% | 1.3% | 0.4% | -4.9% |
| 1993 | 7.0% | 15.5% | 28.9% | 69.4% | 6.7% | 15.1% | 10.7% | 0.2% | 16.3% | 13.9% |
| 1992 | 4.4% | 14.9% | -14.7% | 7.8% | 4.1% | 11.0% | 3.3% | 0.6% | 11.2% | -8.7% |
| 1991 | 26.3% | 40.9% | 8.7% | 54.5% | 11.8% | 25.2% | 7.5% | 2.5% | 31.5% | -12.5% |
| 1990 | -8.9% | -22.8% | -27.9% | -16.1% | 2.4% | -11.3% | -2.7% | 1.6% | -20.3% | -8.3% |
| 1989 | 25.5% | 11.0% | 5.6% | 56.9% | 8.6% | -2.6% | -0.6% | 3.7% | 3.9% | -6.8% |
| 1988 | 11.3% | 19.7% | 22.8% | 33.9% | 2.8% | 8.8% | 4.4% | 2.1% | 8.6% | -19.6% |
| 1987 | 0.3% | -12.7% | 19.3% | 9.3% | -2.8% | -1.7% | 4.5% | 1.3% | -7.8% | 19.0% |
| 1986 | 16.8% | 4.5% | 67.5% | 10.4% | 13.9% | 15.6% | 10.1% | 5.0% | 17.7% | 17.9% |
| 1985 | 26.4% | 26.2% | 50.3% | 22.9% | 17.6% | 17.5% | 7.0% | 3.8% | 14.6% | 1.7% |
*Data for 2020 is as of October 31
The top-performing asset class so far in 2020 is gold, with a return more than four times that of second-place U.S. bonds. On the other hand, real estate investment trusts (REITs) have been the worst-performing investments. Needless to say, economic shutdowns due to COVID-19 have had a devastating effect on commercial real estate.
Over time, the order is fairly random with asset classes moving up and down the ranks. For example, emerging market stocks plummeted to last place amid the global financial crisis in 2008, only to rise to the top the following year. International bonds were near the bottom of the barrel in 2017, but rose to the top during the 2018 market selloff.
There are also large swings in the returns investors can expect in any given year. While the best-performing asset class returned just 1% in 2018, it returned a whopping 71.5% in 2009.
Variation Within Asset Classes
Within individual asset classes, the range in returns can also be quite large. Here’s the minimum, maximum, and average returns for each asset class. We’ve also shown each investment’s standard deviation, which is a measure of volatility or risk.
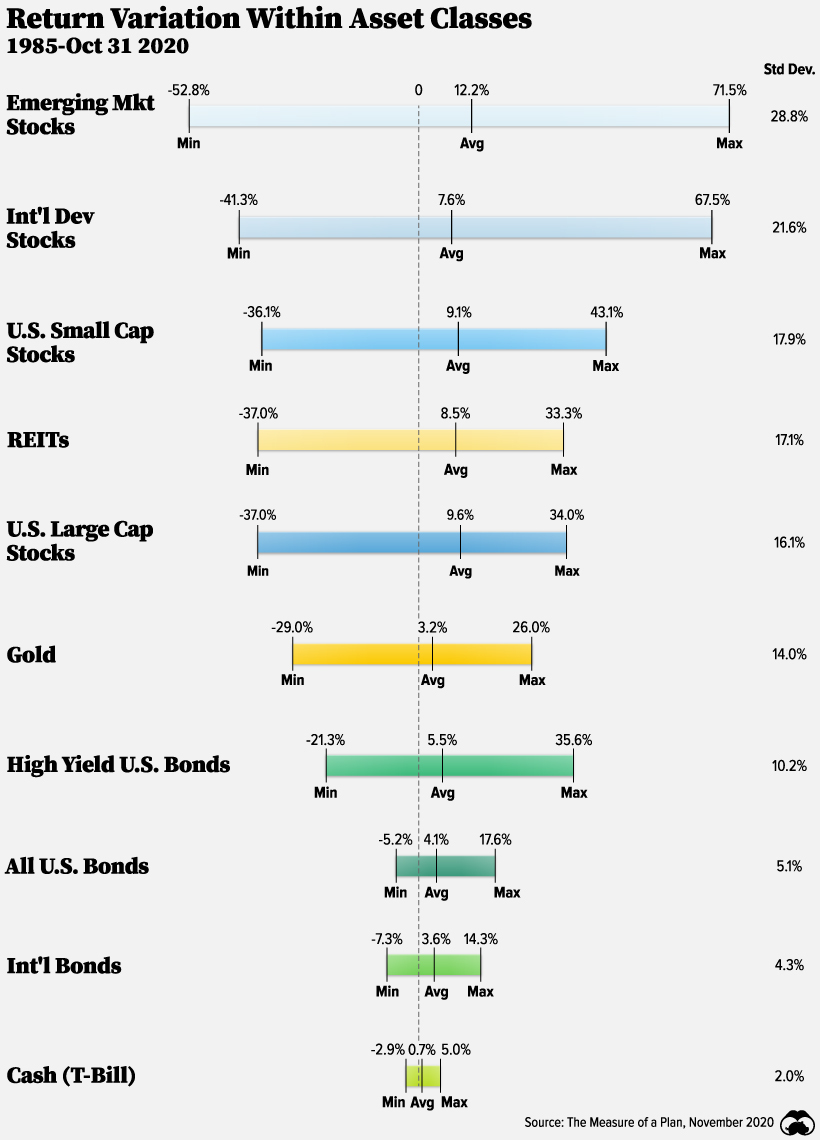
Although emerging market stocks have seen the highest average return, they have also seen the highest standard deviation. On the flip side, T-bills have seen returns lower than inflation since 2009, but have come with the lowest risk.
Investors should factor in risk when they are looking at the return potential of an asset class.
Variety is the Spice of Portfolios
Upon reviewing the historical returns by asset class, there’s no particular investment that has consistently outperformed. Rankings have changed over time depending on a number of economic variables.
However, having a variety of asset classes can ensure you are best positioned to take advantage of tailwinds in any particular year. For instance, bonds have a low correlation with stocks and can cushion against losses during market downturns.
If your mirror could talk, it would tell you there’s no one asset class to rule them all—but a mix of asset classes may be your best chance at success.


Investor Education
The Top 5 Reasons Clients Fire a Financial Advisor
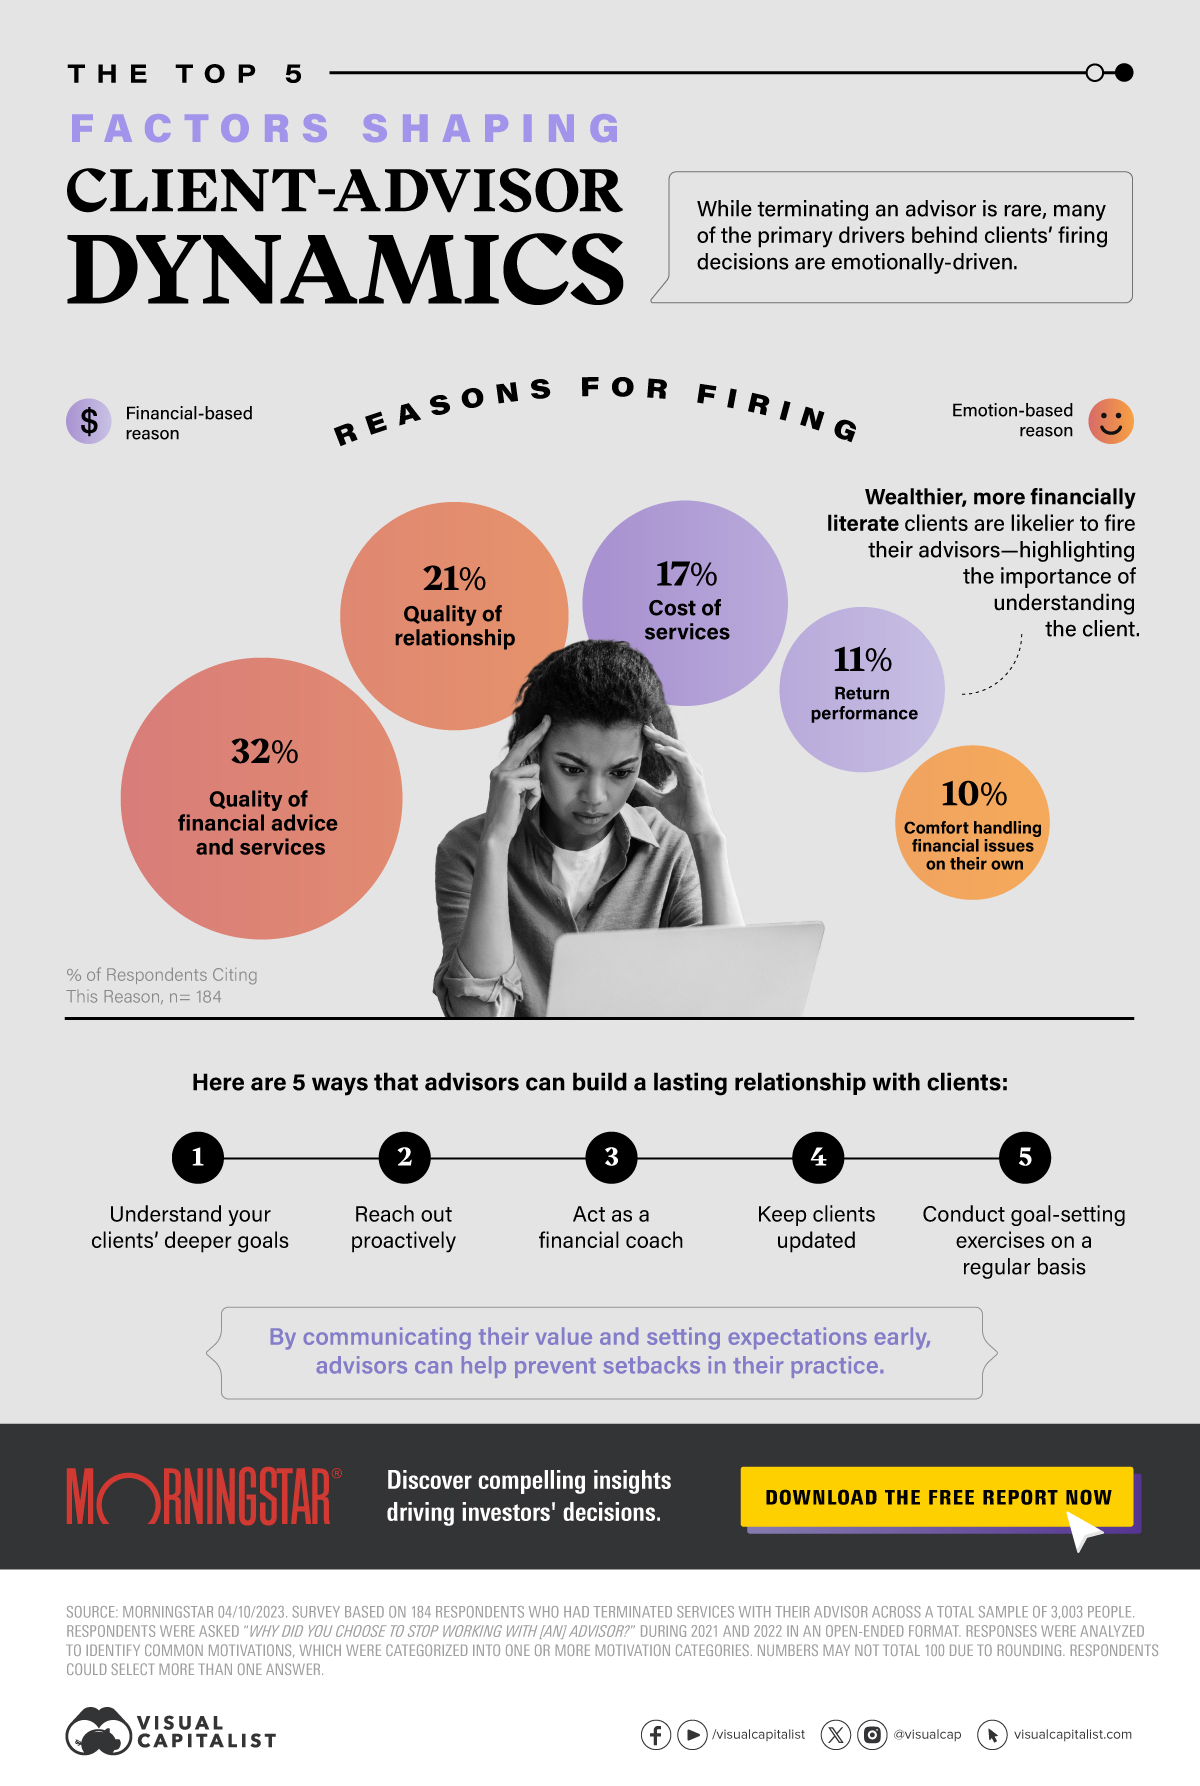
Firing an advisor is often driven by more than cost and performance factors. Here are the top reasons clients ‘break up’ with their advisors.


The Top 5 Reasons Clients Fire a Financial Advisor
What drives investors to fire a financial advisor?
From saving for a down payment to planning for retirement, clients turn to advisors to guide them through life’s complex financial decisions. However, many of the key reasons for firing a financial advisor stem from emotional factors, and go beyond purely financial motivations.
We partnered with Morningstar to show the top reasons clients fire an advisor to provide insight on what’s driving investor behavior.
What Drives Firing Decisions?
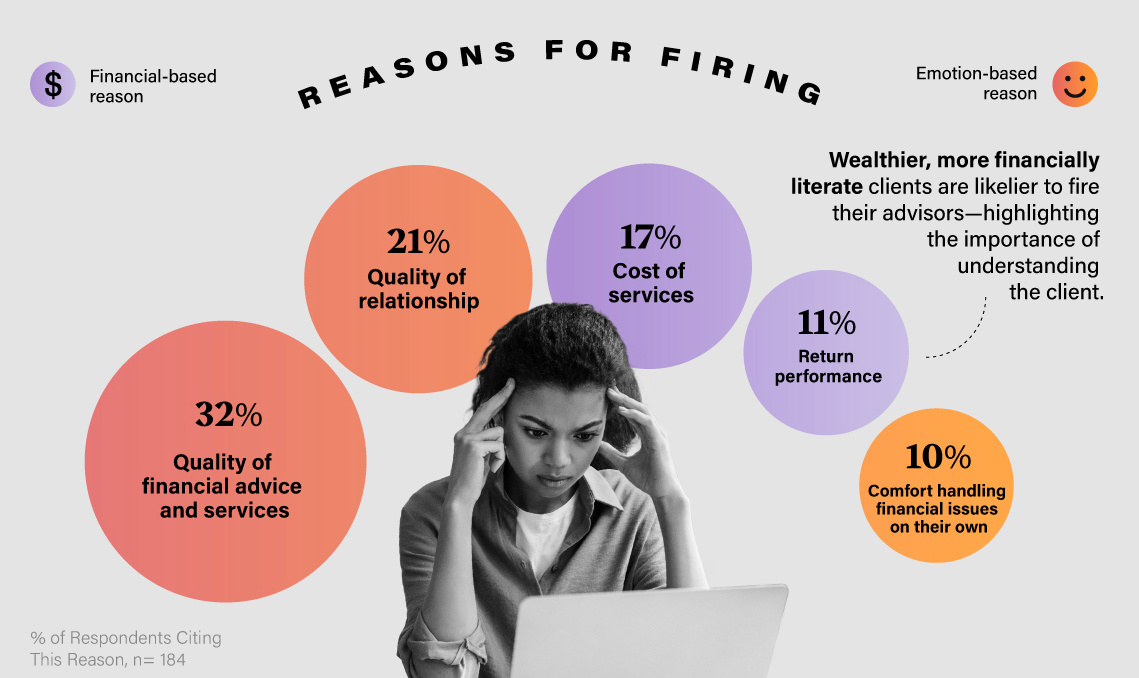
Here are the top reasons clients terminated their advisor, based on a survey of 184 respondents:
| Reason for Firing | % of Respondents Citing This Reason | Type of Motivation |
|---|---|---|
| Quality of financial advice and services | 32% | Emotion-based reason |
| Quality of relationship | 21% | Emotion-based reason |
| Cost of services | 17% | Financial-based reason |
| Return performance | 11% | Financial-based reason |
| Comfort handling financial issues on their own | 10% | Emotion-based reason |
Numbers may not total 100 due to rounding. Respondents could select more than one answer.
While firing an advisor is rare, many of the primary drivers behind firing decisions are also emotionally driven.
Often, advisors were fired due to the quality of the relationship. In many cases, this was due to an advisor not dedicating enough time to fully grasp their personal financial goals. Additionally, wealthier, and more financially literate clients are more likely to fire their advisors—highlighting the importance of understanding the client.
Key Takeaways
Given these driving factors, here are five ways that advisors can build a lasting relationship through recognizing their clients’ emotional needs:
- Understand your clients’ deeper goals
- Reach out proactively
- Act as a financial coach
- Keep clients updated
- Conduct goal-setting exercises on a regular basis
By communicating their value and setting expectations early, advisors can help prevent setbacks in their practice by adeptly recognizing the emotional motivators of their clients.
Curious about what drives investors to hire a financial advisor? Discover the top 5 reasons here.

-

 Investor Education5 months ago
The 20 Most Common Investing Mistakes, in One Chart
Here are the most common investing mistakes to avoid, from emotionally-driven investing to paying too much in fees.
-

 Stocks10 months ago
Visualizing BlackRock’s Top Equity Holdings
BlackRock is the world’s largest asset manager, with over $9 trillion in holdings. Here are the company’s top equity holdings.
-

 Investor Education10 months ago
10-Year Annualized Forecasts for Major Asset Classes
This infographic visualizes 10-year annualized forecasts for both equities and fixed income using data from Vanguard.
-

 Investor Education1 year ago
Visualizing 90 Years of Stock and Bond Portfolio Performance
How have investment returns for different portfolio allocations of stocks and bonds compared over the last 90 years?
-

 Debt2 years ago
Countries with the Highest Default Risk in 2022
In this infographic, we examine new data that ranks the top 25 countries by their default risk.
-

 Markets2 years ago
The Best Months for Stock Market Gains
This infographic analyzes over 30 years of stock market performance to identify the best and worst months for gains.


-

 Business2 weeks ago
America’s Top Companies by Revenue (1994 vs. 2023)
-

 Environment1 week ago
Ranked: Top Countries by Total Forest Loss Since 2001
-

 Markets1 week ago
Visualizing America’s Shortage of Affordable Homes
-

 Maps2 weeks ago
Mapped: Average Wages Across Europe
-

 Mining2 weeks ago
Charted: The Value Gap Between the Gold Price and Gold Miners
-

 Demographics2 weeks ago
Visualizing the Size of the Global Senior Population
-

 Misc2 weeks ago
Tesla Is Once Again the World’s Best-Selling EV Company
-

 Technology2 weeks ago
Ranked: The Most Popular Smartphone Brands in the U.S.