Markets
Ranked: The Most Valuable Nation Brands in 2020
The Most Valuable Nation Brands in 2020
In today’s heavily interconnected world, a country’s reputation can have a big impact on its overall economic prosperity.
In fact, a country’s reputation—its brand—is arguably one of its most important assets. A strong nation brand has the power to boost tourism, attract and retain talent, and potentially bring in foreign investment.
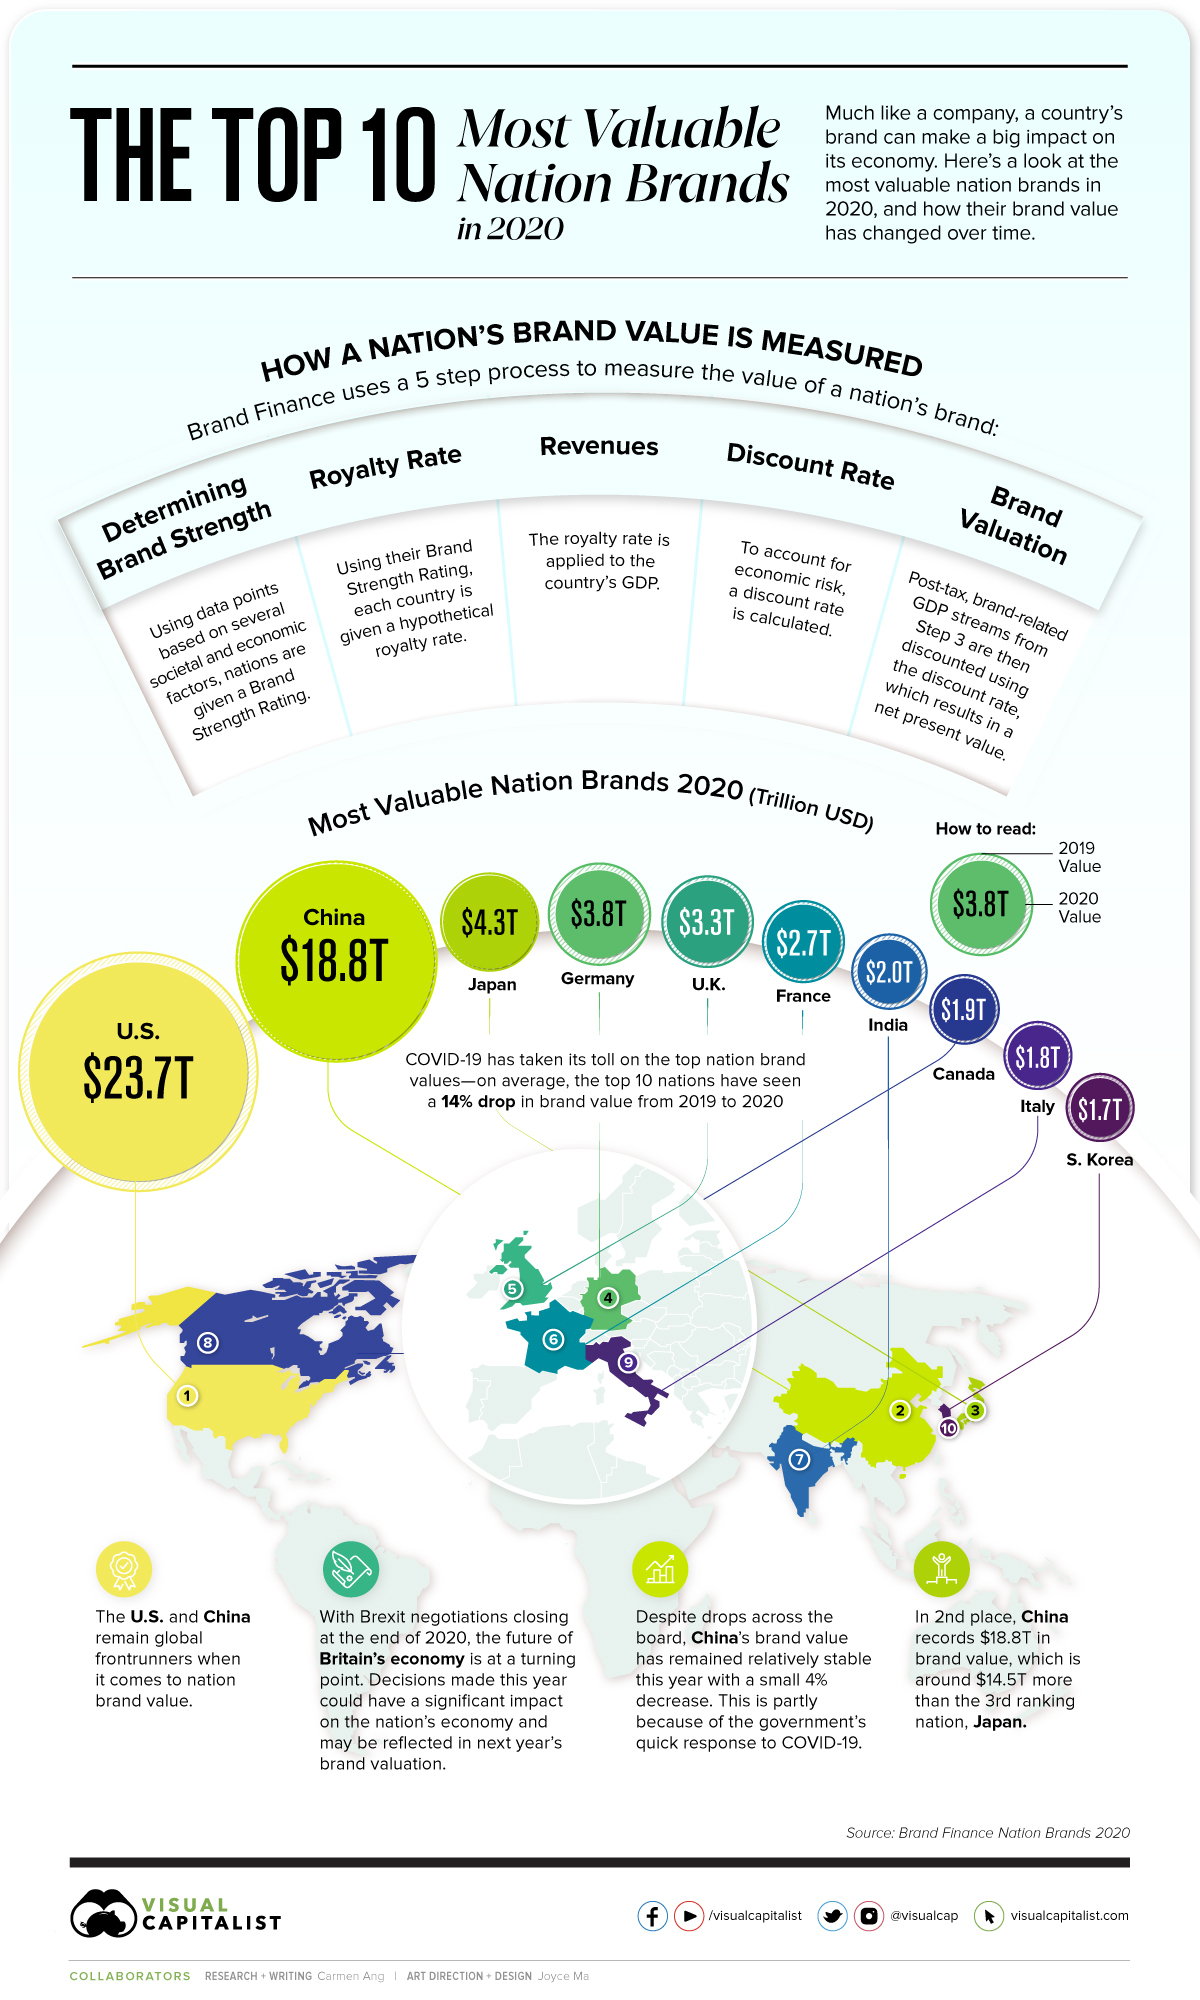
This graphic uses data from Brand Finance’s Nation Brands 2020 report, which attempts to quantify the reputations of different countries around the world. We’ll also dive into the top 10 nation brands, and how their brand value has changed over time.
How is Nation Brand Value Quantified?
While the report provides a full explanation of its methodology, here’s a quick summary of how the scoring system works.
First, Brand Finance calculates a country’s Brand Strength Index (BSI) score using three pillars:
- Goods & Services
Openness to tourism, market size, and trade rules - Society
Quality of life, corruption, and cultural image - Investment
Talent retention, use of technology, R&D, taxation, and regulation
From there, the BSI score is used to calculate a hypothetical royalty rate, and applied to a country’s GDP. Then, a discount rate is factored in to account for economic risk. Finally, numbers are crunched to provide the “Brand Value” of a country.
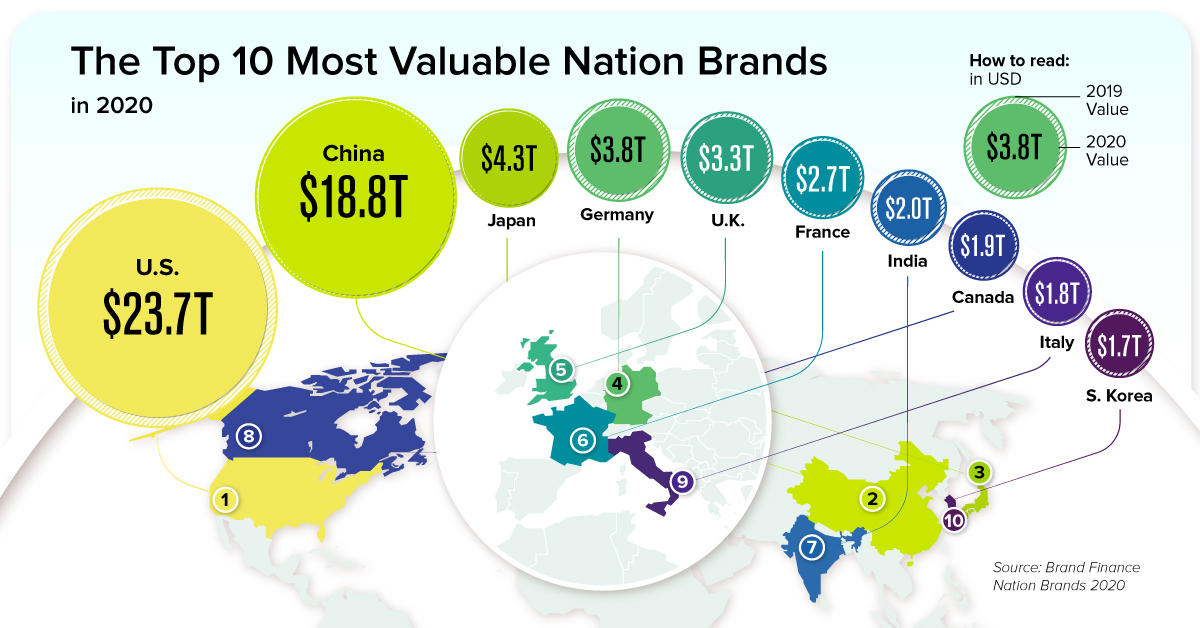
The Top 10 Most Valuable Nation Brands
In this year’s report, Brand Finance highlights the impact COVID-19 has had on nation brand values—in 2020, the top 10 nation brands have seen a 14% drop in brand value, on average.
Here are the most valuable nation brands of 2020, and their change in value since last year:
| Rank | Country | 2020 Value (USD, $T) | Change since 2019 |
|---|---|---|---|
| 1 | 🇺🇸 United States | $23.7 | -14.5% |
| 2 | 🇨🇳 China | $18.8 | -3.7% |
| 3 | 🇯🇵 Japan | $4.3 | -6.0% |
| 4 | 🇩🇪 Germany | $3.8 | -21.5% |
| 5 | 🇬🇧 United Kingdom | $3.3 | -13.9% |
| 6 | 🇫🇷 France | $2.7 | -12.8% |
| 7 | 🇮🇳 India | $2.0 | -20.8% |
| 8 | 🇨🇦 Canada | $1.9 | -13.0% |
| 9 | 🇮🇹 Italy | $1.8 | -15.8% |
| 10 | 🇰🇷 South Korea | $1.7 | -20.6% |
Despite a 14.5% decrease in value, the U.S. managed to maintain its top position with a nation brand value of $23.7 trillion.
Like many other countries, 2020 has been a tough year for America. From recording the most COVID-19 cases and deaths to dealing with a controversial presidential election, the economic powerhouse faced a tremendous amount of international scrutiny this year.
Despite all this, the United States remains one of the most successful and dominant economies worldwide—the only close competitor is China, with a nation brand value of $18.8 trillion.
Over the Years: China’s Steady Climb
While China still ranks below the U.S. in total brand value, its percentage decrease from last year was far lower than the other nations on the list. China stayed relatively stable with a modest 4% drop, about 10 percentage points less than the global average.
China’s stability this year is nothing new. In fact, the country has been steadily closing the brand value gap between itself and the U.S. since 2015:
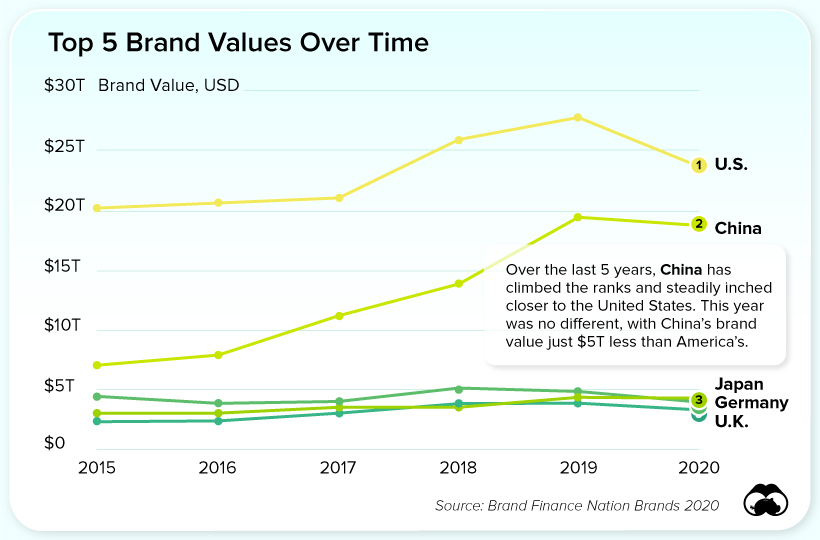
This year marks the smallest gap yet, with just a $4.9 trillion brand value difference between the U.S. and China. This is significantly lower than in previous years—for instance, in 2015 the U.S. had a $13.1 trillion lead over China.
Will America make a comeback in 2021 under a new administration, or will the gap between it and China close even further?


Markets
The European Stock Market: Attractive Valuations Offer Opportunities
On average, the European stock market has valuations that are nearly 50% lower than U.S. valuations. But how can you access the market?


European Stock Market: Attractive Valuations Offer Opportunities
Europe is known for some established brands, from L’Oréal to Louis Vuitton. However, the European stock market offers additional opportunities that may be lesser known.
The above infographic, sponsored by STOXX, outlines why investors may want to consider European stocks.
Attractive Valuations
Compared to most North American and Asian markets, European stocks offer lower or comparable valuations.
| Index | Price-to-Earnings Ratio | Price-to-Book Ratio |
|---|---|---|
| EURO STOXX 50 | 14.9 | 2.2 |
| STOXX Europe 600 | 14.4 | 2 |
| U.S. | 25.9 | 4.7 |
| Canada | 16.1 | 1.8 |
| Japan | 15.4 | 1.6 |
| Asia Pacific ex. China | 17.1 | 1.8 |
Data as of February 29, 2024. See graphic for full index names. Ratios based on trailing 12 month financials. The price to earnings ratio excludes companies with negative earnings.
On average, European valuations are nearly 50% lower than U.S. valuations, potentially offering an affordable entry point for investors.
Research also shows that lower price ratios have historically led to higher long-term returns.
Market Movements Not Closely Connected
Over the last decade, the European stock market had low-to-moderate correlation with North American and Asian equities.
The below chart shows correlations from February 2014 to February 2024. A value closer to zero indicates low correlation, while a value of one would indicate that two regions are moving in perfect unison.
| EURO STOXX 50 | STOXX EUROPE 600 | U.S. | Canada | Japan | Asia Pacific ex. China |
|
|---|---|---|---|---|---|---|
| EURO STOXX 50 | 1.00 | 0.97 | 0.55 | 0.67 | 0.24 | 0.43 |
| STOXX EUROPE 600 | 1.00 | 0.56 | 0.71 | 0.28 | 0.48 | |
| U.S. | 1.00 | 0.73 | 0.12 | 0.25 | ||
| Canada | 1.00 | 0.22 | 0.40 | |||
| Japan | 1.00 | 0.88 | ||||
| Asia Pacific ex. China | 1.00 |
Data is based on daily USD returns.
European equities had relatively independent market movements from North American and Asian markets. One contributing factor could be the differing sector weights in each market. For instance, technology makes up a quarter of the U.S. market, but health care and industrials dominate the broader European market.
Ultimately, European equities can enhance portfolio diversification and have the potential to mitigate risk for investors.
Tracking the Market
For investors interested in European equities, STOXX offers a variety of flagship indices:
| Index | Description | Market Cap |
|---|---|---|
| STOXX Europe 600 | Pan-regional, broad market | €10.5T |
| STOXX Developed Europe | Pan-regional, broad-market | €9.9T |
| STOXX Europe 600 ESG-X | Pan-regional, broad market, sustainability focus | €9.7T |
| STOXX Europe 50 | Pan-regional, blue-chip | €5.1T |
| EURO STOXX 50 | Eurozone, blue-chip | €3.5T |
Data is as of February 29, 2024. Market cap is free float, which represents the shares that are readily available for public trading on stock exchanges.
The EURO STOXX 50 tracks the Eurozone’s biggest and most traded companies. It also underlies one of the world’s largest ranges of ETFs and mutual funds. As of November 2023, there were €27.3 billion in ETFs and €23.5B in mutual fund assets under management tracking the index.
“For the past 25 years, the EURO STOXX 50 has served as an accurate, reliable and tradable representation of the Eurozone equity market.”
— Axel Lomholt, General Manager at STOXX
Partnering with STOXX to Track the European Stock Market
Are you interested in European equities? STOXX can be a valuable partner:
- Comprehensive, liquid and investable ecosystem
- European heritage, global reach
- Highly sophisticated customization capabilities
- Open architecture approach to using data
- Close partnerships with clients
- Part of ISS STOXX and Deutsche Börse Group
With a full suite of indices, STOXX can help you benchmark against the European stock market.
Learn how STOXX’s European indices offer liquid and effective market access.

-

 Economy1 day ago
Economic Growth Forecasts for G7 and BRICS Countries in 2024
The IMF has released its economic growth forecasts for 2024. How do the G7 and BRICS countries compare?
-

 Markets1 week ago
U.S. Debt Interest Payments Reach $1 Trillion
U.S. debt interest payments have surged past the $1 trillion dollar mark, amid high interest rates and an ever-expanding debt burden.
-

 United States1 week ago
Ranked: The Largest U.S. Corporations by Number of Employees
We visualized the top U.S. companies by employees, revealing the massive scale of retailers like Walmart, Target, and Home Depot.
-

 Markets2 weeks ago
The Top 10 States by Real GDP Growth in 2023
This graphic shows the states with the highest real GDP growth rate in 2023, largely propelled by the oil and gas boom.
-

 Markets2 weeks ago
Ranked: The World’s Top Flight Routes, by Revenue
In this graphic, we show the highest earning flight routes globally as air travel continued to rebound in 2023.
-

 Markets2 weeks ago
Ranked: The Most Valuable Housing Markets in America
The U.S. residential real estate market is worth a staggering $47.5 trillion. Here are the most valuable housing markets in the country.


-

 Mining1 week ago
Gold vs. S&P 500: Which Has Grown More Over Five Years?
-
Markets2 weeks ago
Ranked: The Most Valuable Housing Markets in America
-

 Money2 weeks ago
Which States Have the Highest Minimum Wage in America?
-

 AI2 weeks ago
Ranked: Semiconductor Companies by Industry Revenue Share
-
Markets2 weeks ago
Ranked: The World’s Top Flight Routes, by Revenue
-

 Demographics2 weeks ago
Population Projections: The World’s 6 Largest Countries in 2075
-
Markets2 weeks ago
The Top 10 States by Real GDP Growth in 2023
-

 Demographics2 weeks ago
The Smallest Gender Wage Gaps in OECD Countries