Get Started with Power BI Desktop in 10 Minutes! – A Comprehensive Guide
FREE Online Courses: Knowledge Awaits – Click for Free Access!
Whenever you will search for Power BI Desktop on Google, you will find many websites covering the installation and functions of Power BI in a technical language. But, here I am providing you with all the aspects of Power BI in a very simple language. So, let us get started right away!
What is Power BI Desktop?
Power BI Desktop is a free development, authoring, and publishing tool of Power BI. It is a user interaction platform from where users can connect to multiple data sources, transform and clean data, visualize and create reports. Power BI Desktop is a user-friendly development platform leveraging on all the capabilities of Power BI.
One can easily connect to multiple data sources and consolidate the data from them into one data model which is known as modeling. The data models structure the imported information (data), create associations and relations between data values, etc. One can also represent the data in the form of a variety of visualizations available in Power BI Desktop. You can share your creations made in Power BI as reports and dashboards to other users for analysis and collaboration. The most common users of Power BI Desktop are data analysts, BI professionals, report creators, or simple business users.
I suggest you to check Latest Power BI Features
Benefits of Power BI Desktop
Power BI Desktop is rapidly becoming the user’s most favorite BI tool. It offers many advantages over other BI tools in the market.
- You can connect to a range of on-premise as well as cloud-based data sources such as Salesforce, Azure SQL DB, Dynamics 365, SharePoint and Excel. Power BI Desktop offers features of automated or incremental refreshing of data from the data source.
- You don’t need to waste much time in data preparation. Power BI Desktop offers self-service data modeling tools which efficiently helps in data preparation and data model.
- Power BI Desktop offers many advanced analytics functionalities such as DAX formula language, quick measures, grouping, forecasting, Excel integration, and clustering.
- It enables the user to create visualization-rich dashboards and reports. One can use them in formatting and layout tools available in Power BI Desktop.
- You can also create mobile-optimized reports so that viewers can use them instantly on the go. In addition to this, you can publish your reports and apps to the cloud or on-premise platforms. You can also embed Power BI Desktop reports into apps or websites.
Must Learn – How to Create Power BI Dashboard
Installing Power BI Desktop
Follow the steps given in this section to install Power BI Desktop on your system.
Step 1: Power BI Desktop is a free-of-cost tool. To download it, go to the official site of Power BI – Power BI.com.
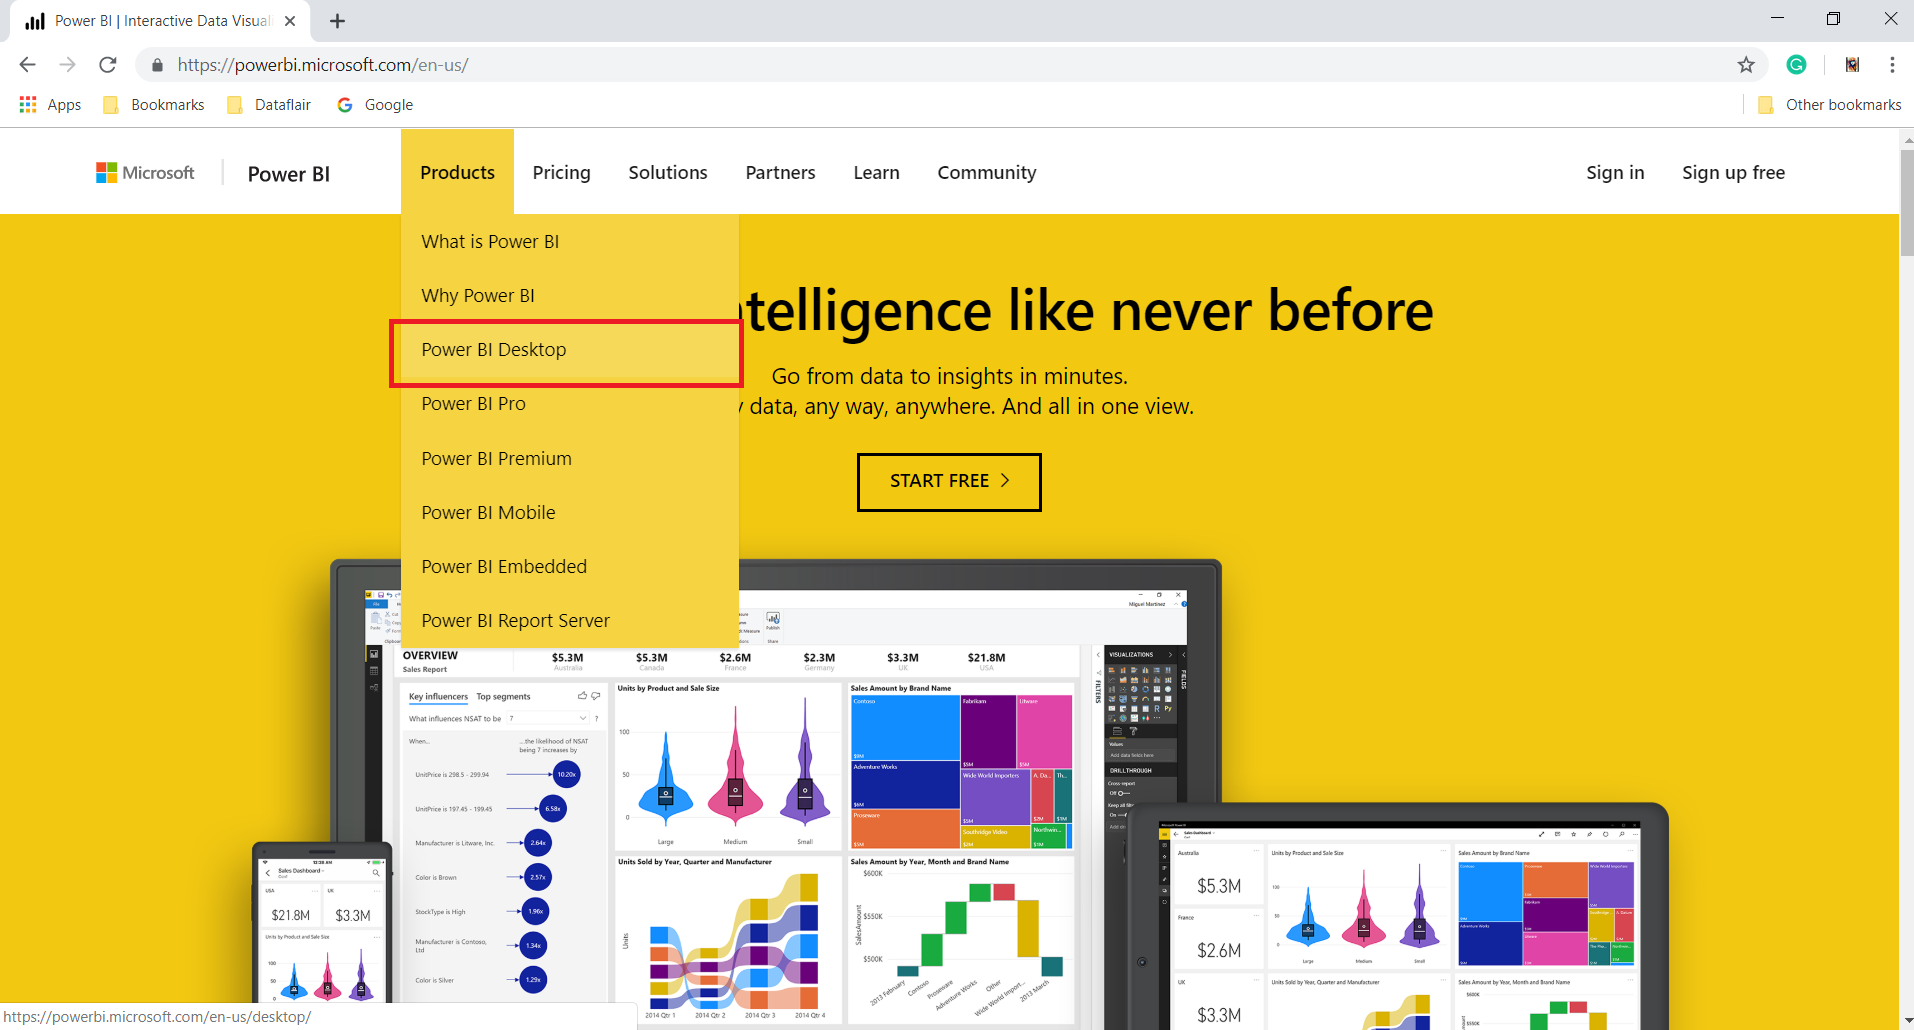
Once the site opens, click on Products tab then select Power BI Desktop from the drop-down list.
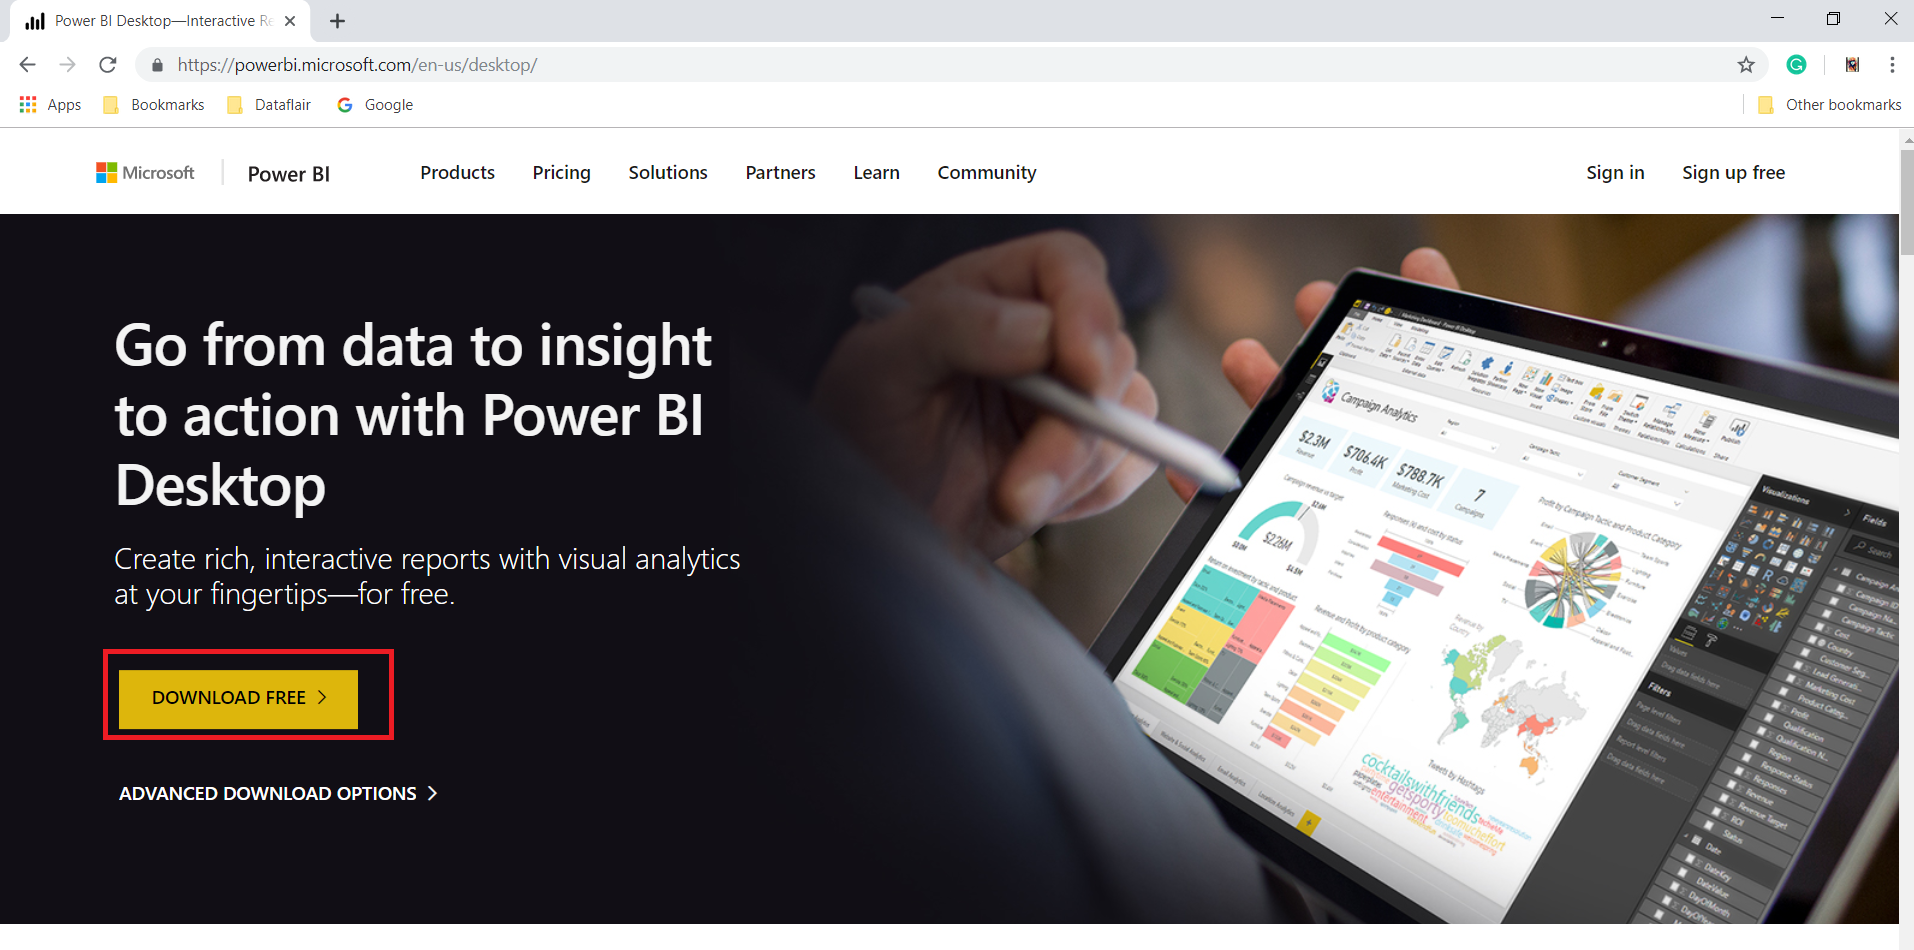
It will re-direct you to a Power BI Desktop download page. Click on DOWNLOAD FREE.
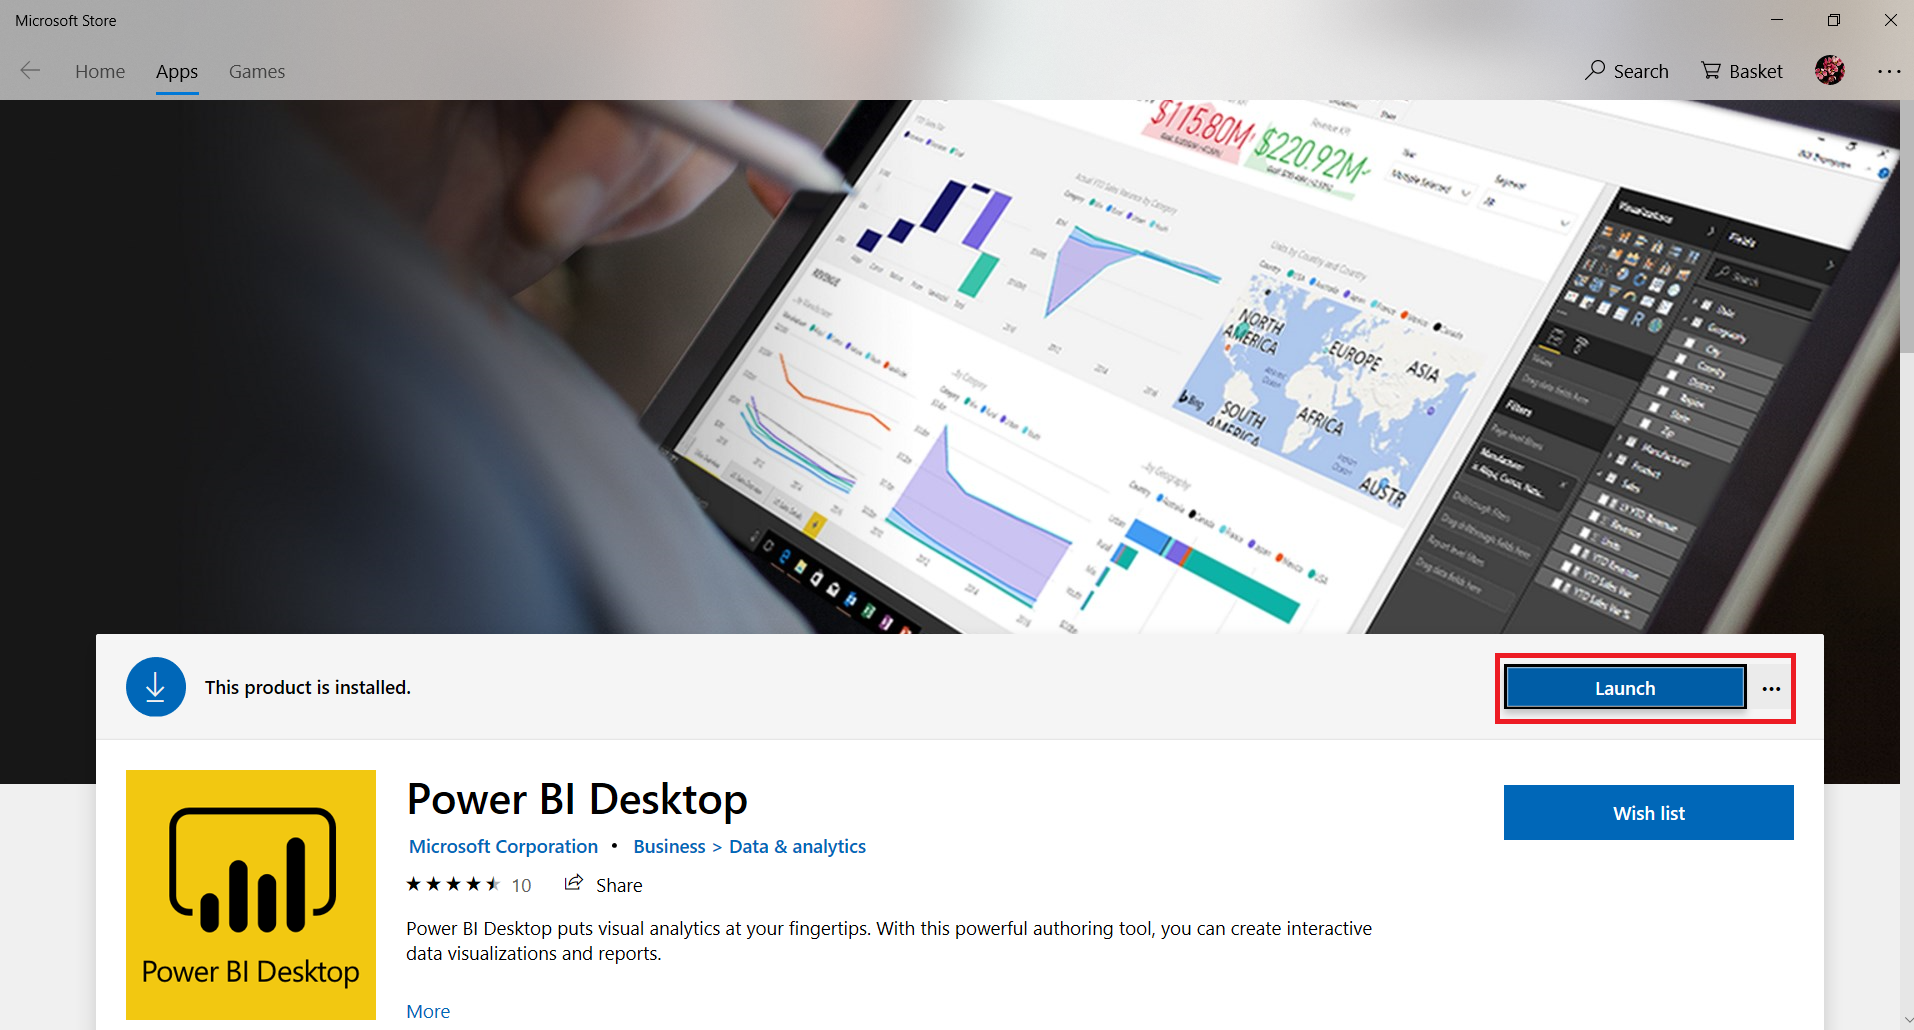
Step 2: Complete the installation process and Launch the software.
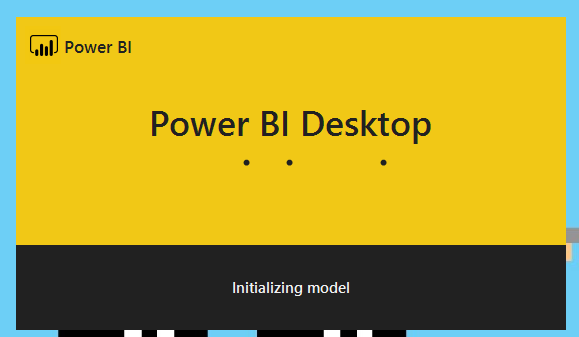
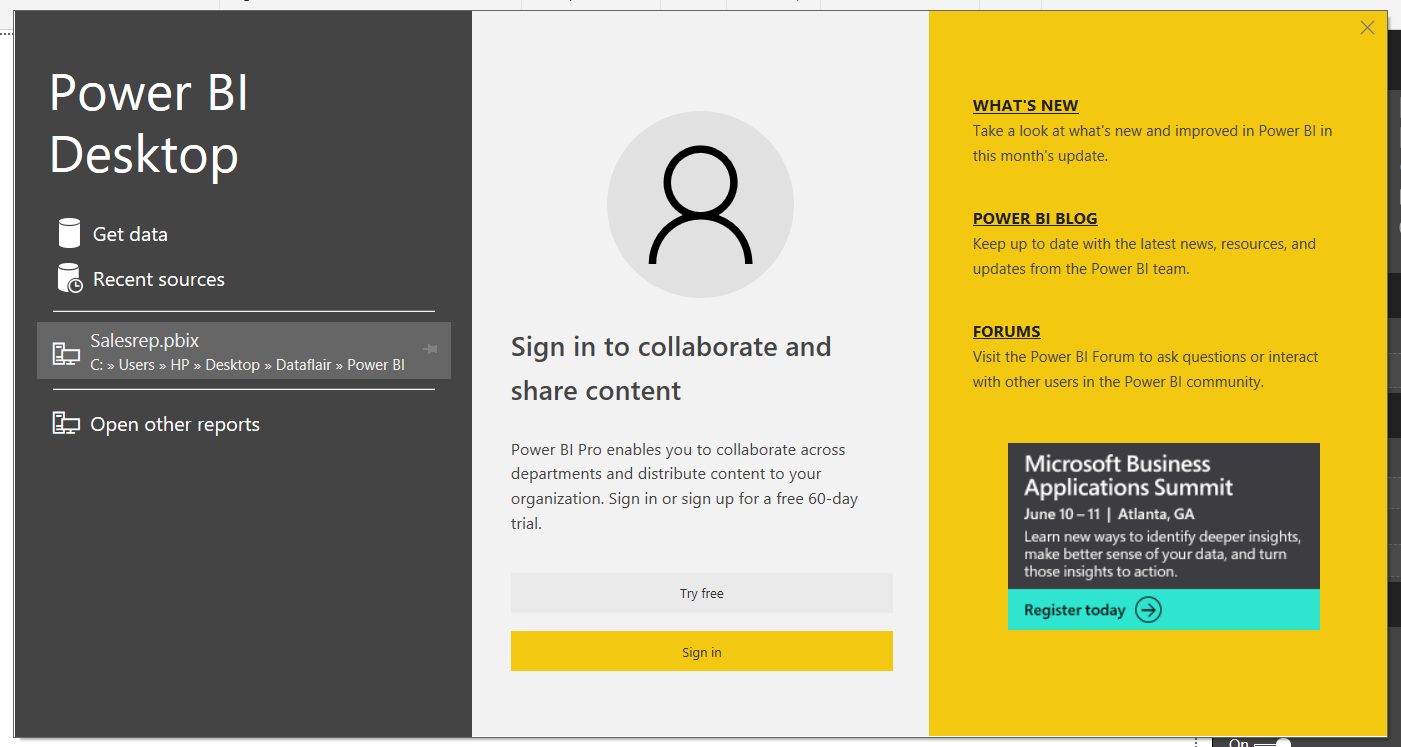
The Power BI Desktop pop-up will appear saying “Initializing model”. It might take a while.
Step 3: The Power BI Desktop will open showing the start page. You can sign-in with a free account or get a paid account. The main difference between the two kinds of usage is the availability of data usage capacity. Please note that you can only sign-in for a Power BI account with a work email id.
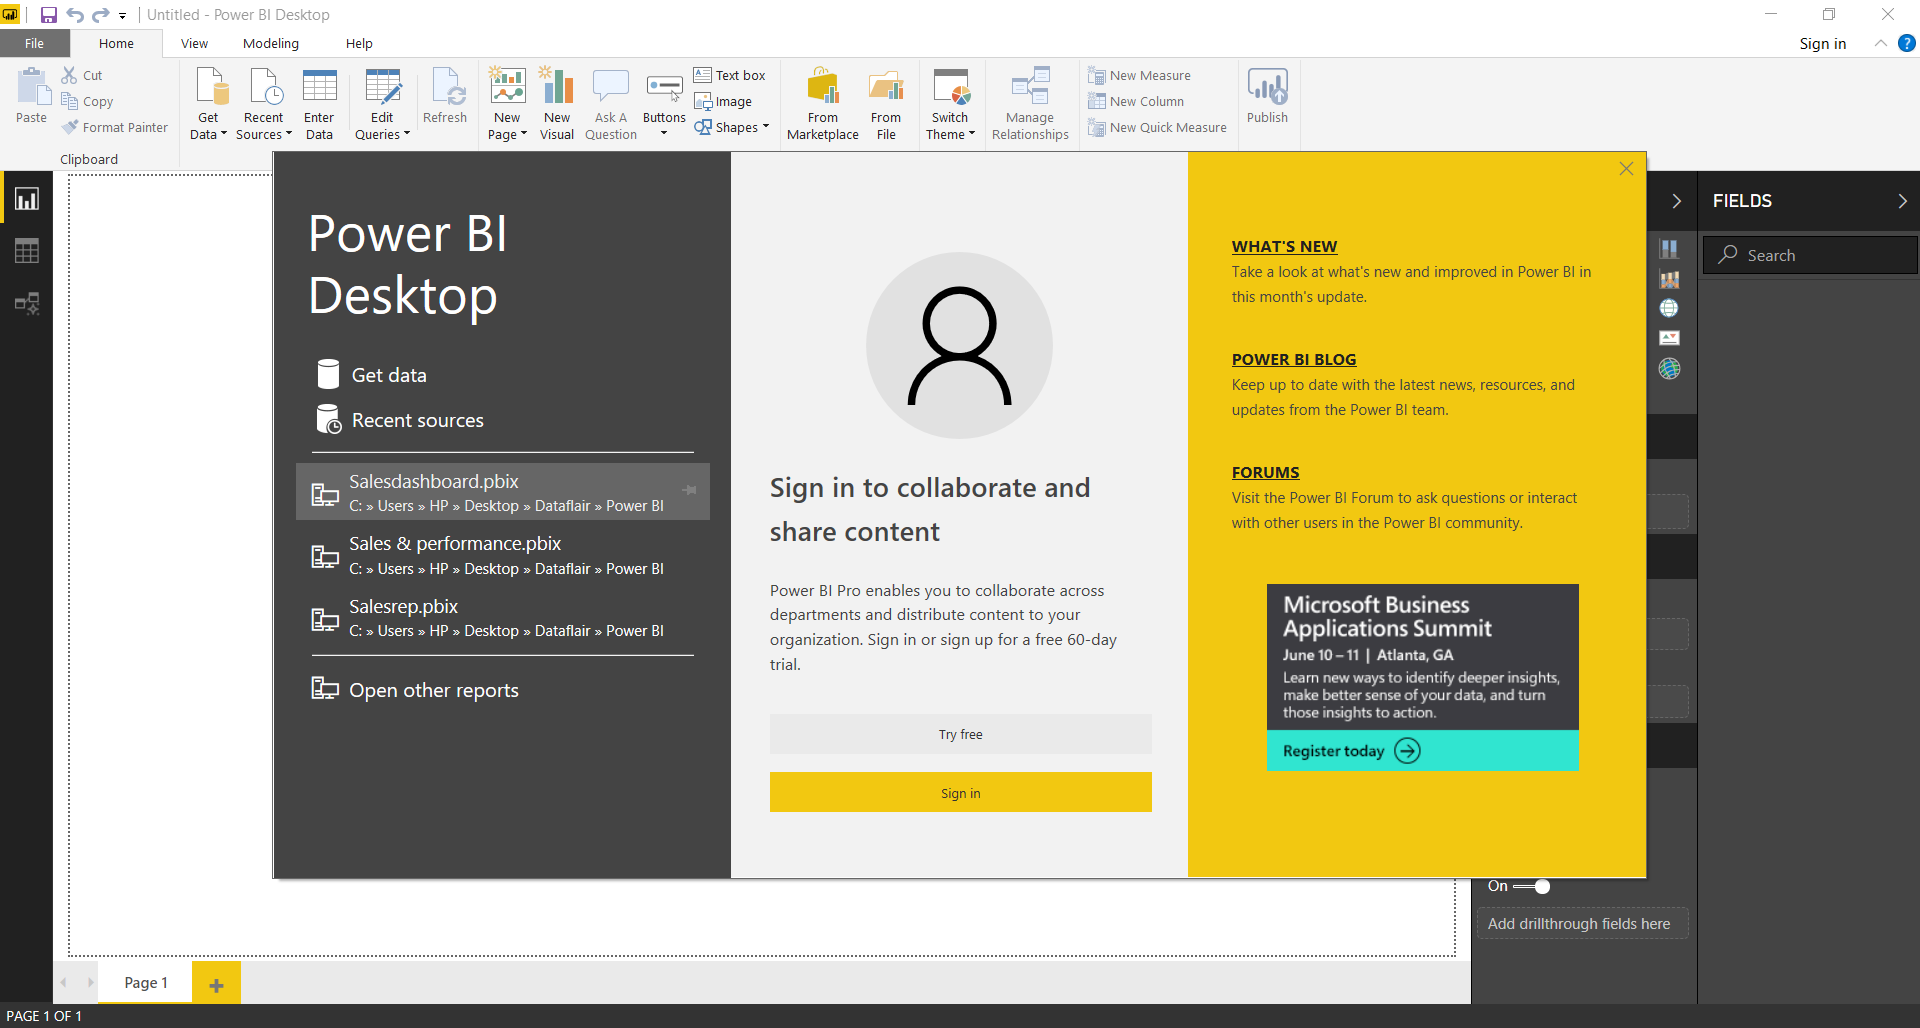
If you create a free account, then you can start working on Power BI Desktop right away and import data using Get data option.
Do you know – How to Connect to Data in Power BI Desktop
Functions and Uses of Power BI Desktop
In this section, we’ll discuss what all can you do with Power BI Desktop.
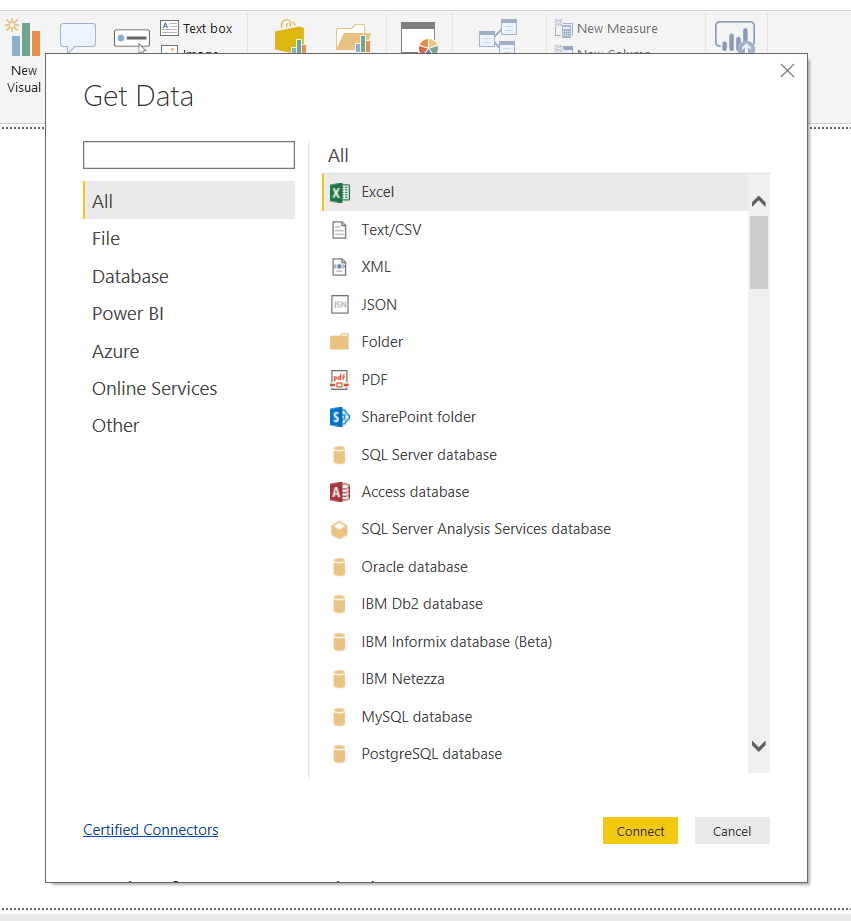
1. Connecting to data
The first task when you start off with working on Power BI Desktop is to connect to a data source and fetch data. With the Get Data option in Power BI Desktop, you can select from a long list of available data sources. You can either select Get Data option from the dialog that opens just after opening the Power BI Desktop.
 Or you can go to the Get Data option from the Home tab on the Power BI Desktop. Select More.. to explore more options.
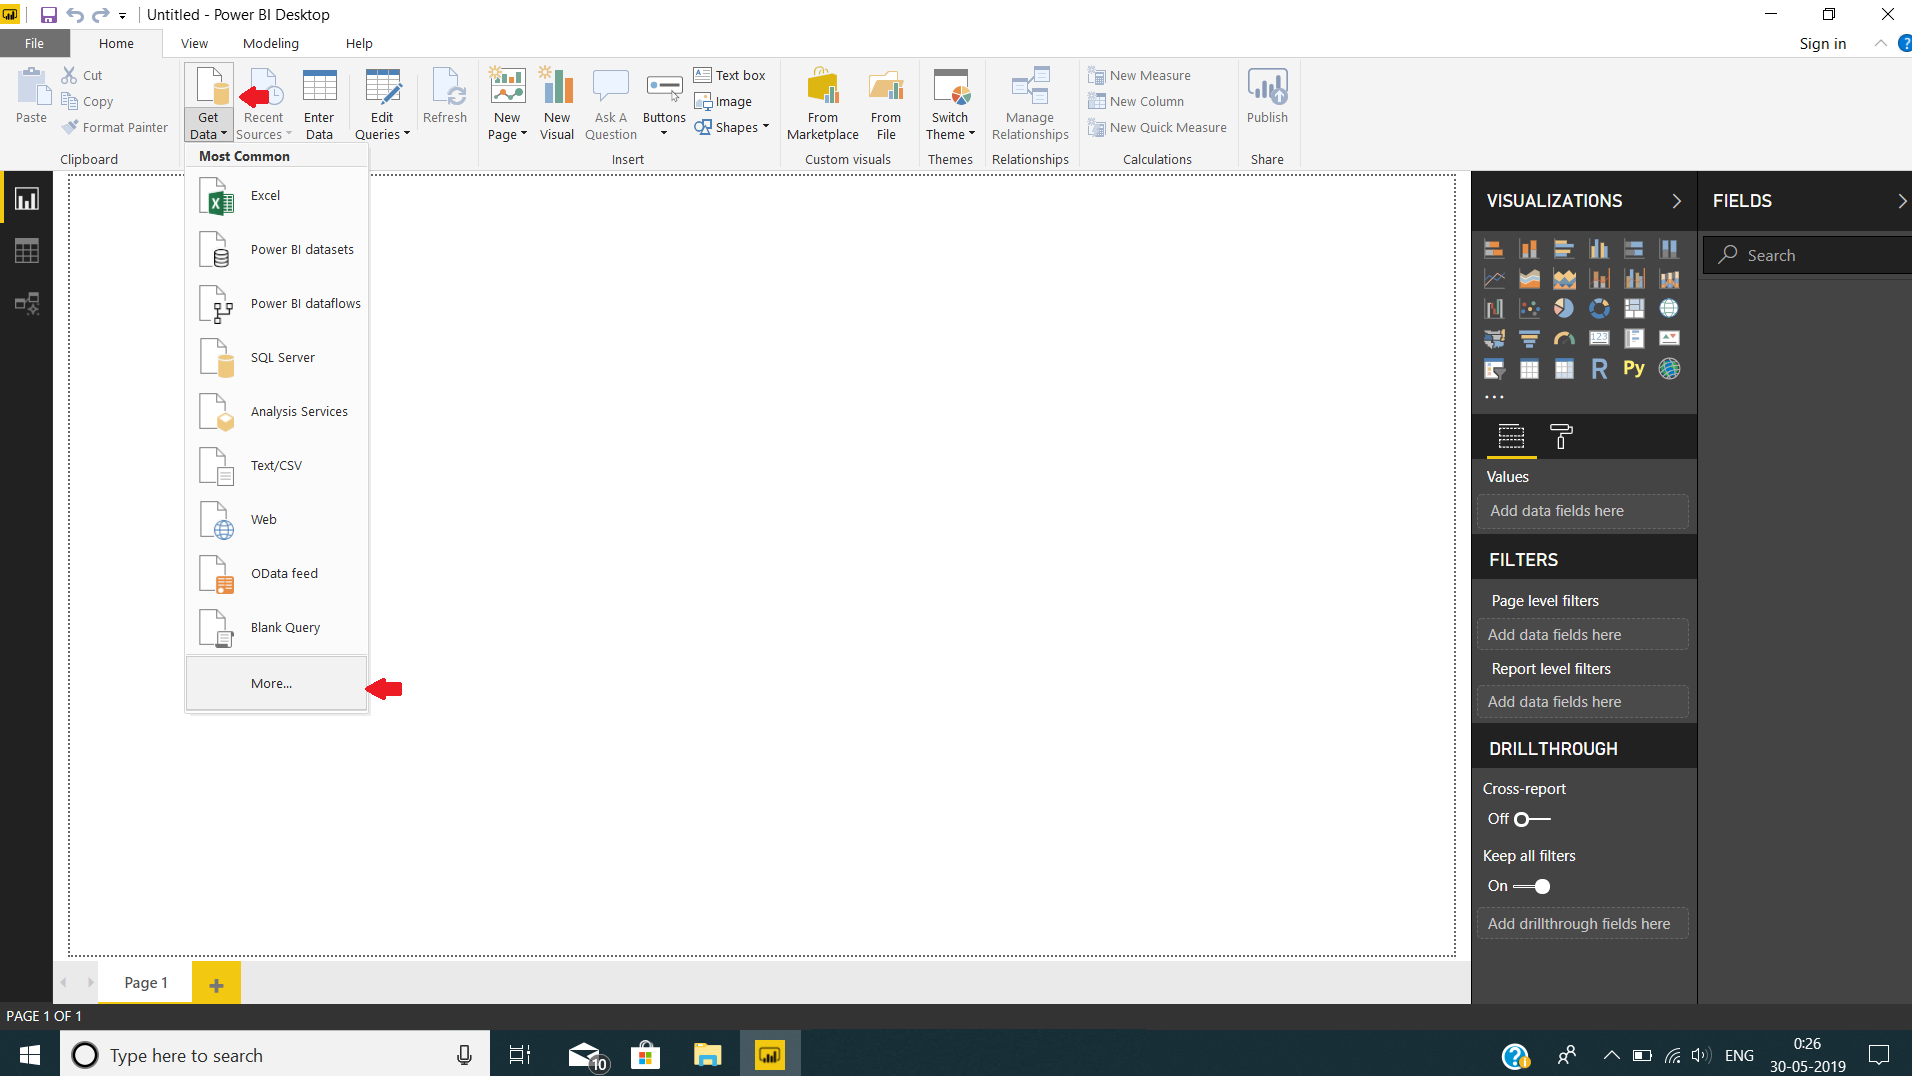
Select the data source from the given list and click on Connect. You can select from a list of available Certified Connectors.
2. Transform and clean data
As soon as you connect to a data source, you can transform and clean your data. To transform and clean your data, Power BI provides you with an in-built Power Query Editor.
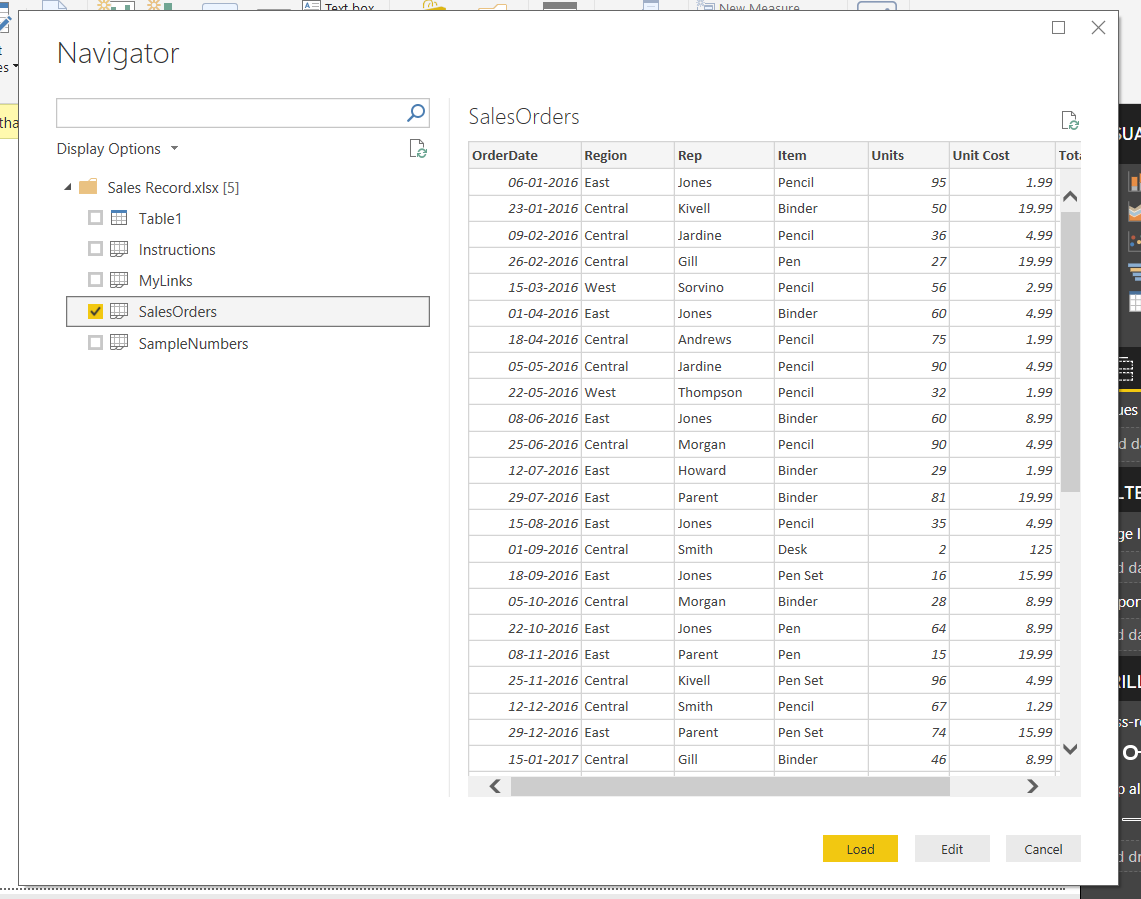
A Navigator window will ask you to Edit your data or Load it right away. If you select Edit option, then the query editor will open in a separate window.
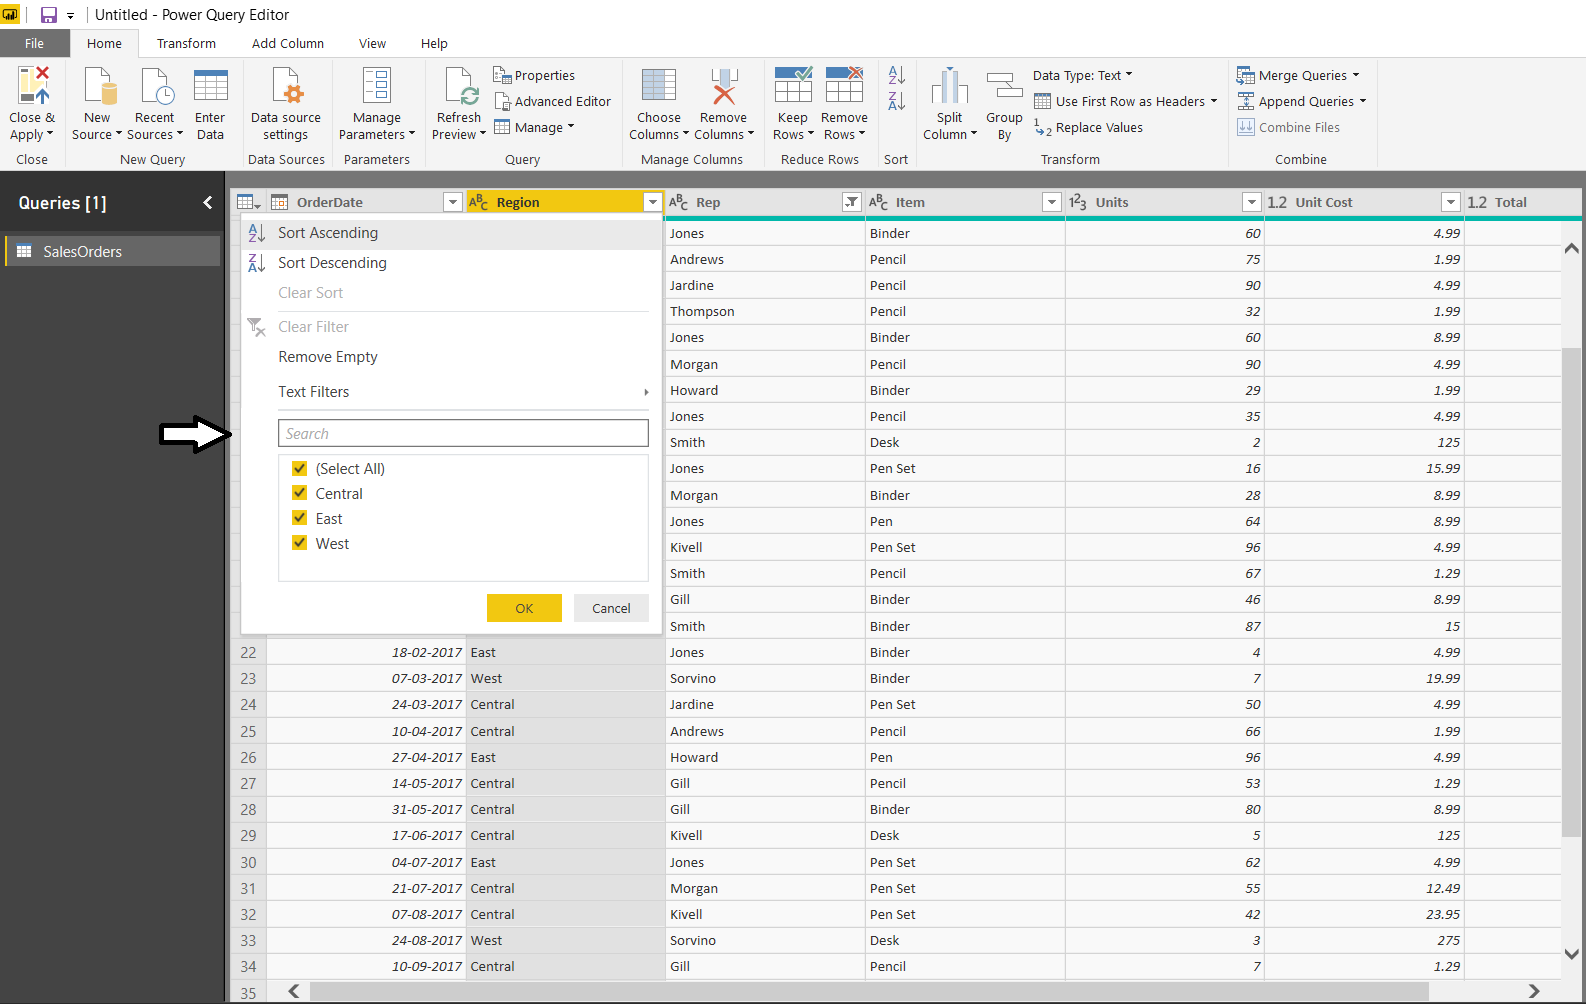
In the Power Query Editor, you can rename the table, change the data type, removing or adding columns, applying filters, and combining data from multiple sources.
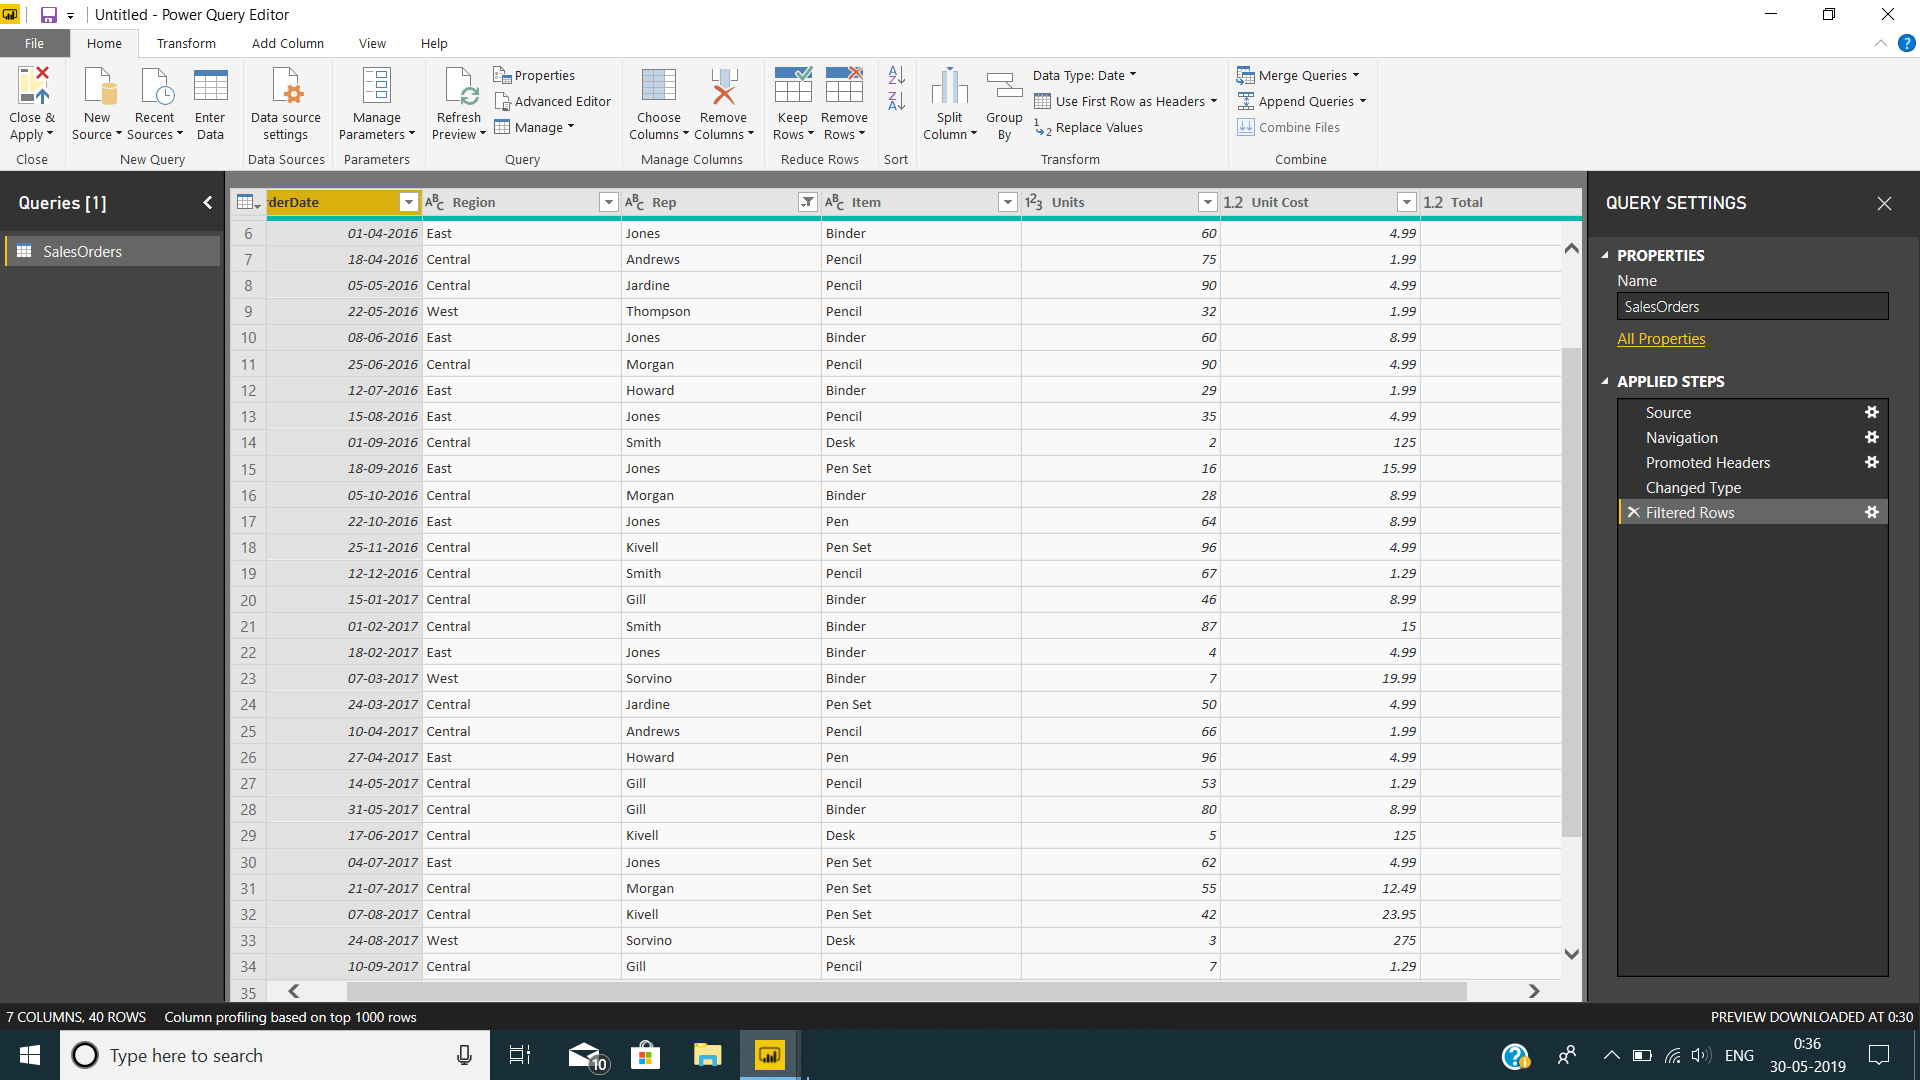
Whatever actions you apply using the Query Editor, it will get recorded and registered in the system. By doing so, the same data transformation and cleaning steps will be applied automatically every time you open the data source.
You can view the transformation steps applied to the loaded data in the Applied Steps section.
Also, you can apply sort order and filters on every column of your table. Click on Close & Apply once you are done.
3. Creating visualizations
Once your data is transformed and loaded into Power BI Desktop, you can create visualizations using the data model. You will get a set of visualizations in the Visualizations pane given on the top right.
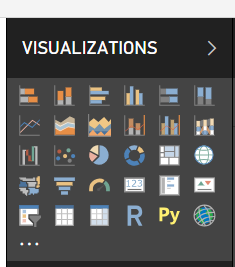
To create a visualization, select a visualization type from the Visualizations section. Then, drag and drop the columns (dimensions/measures) from Fields section to the empty space.
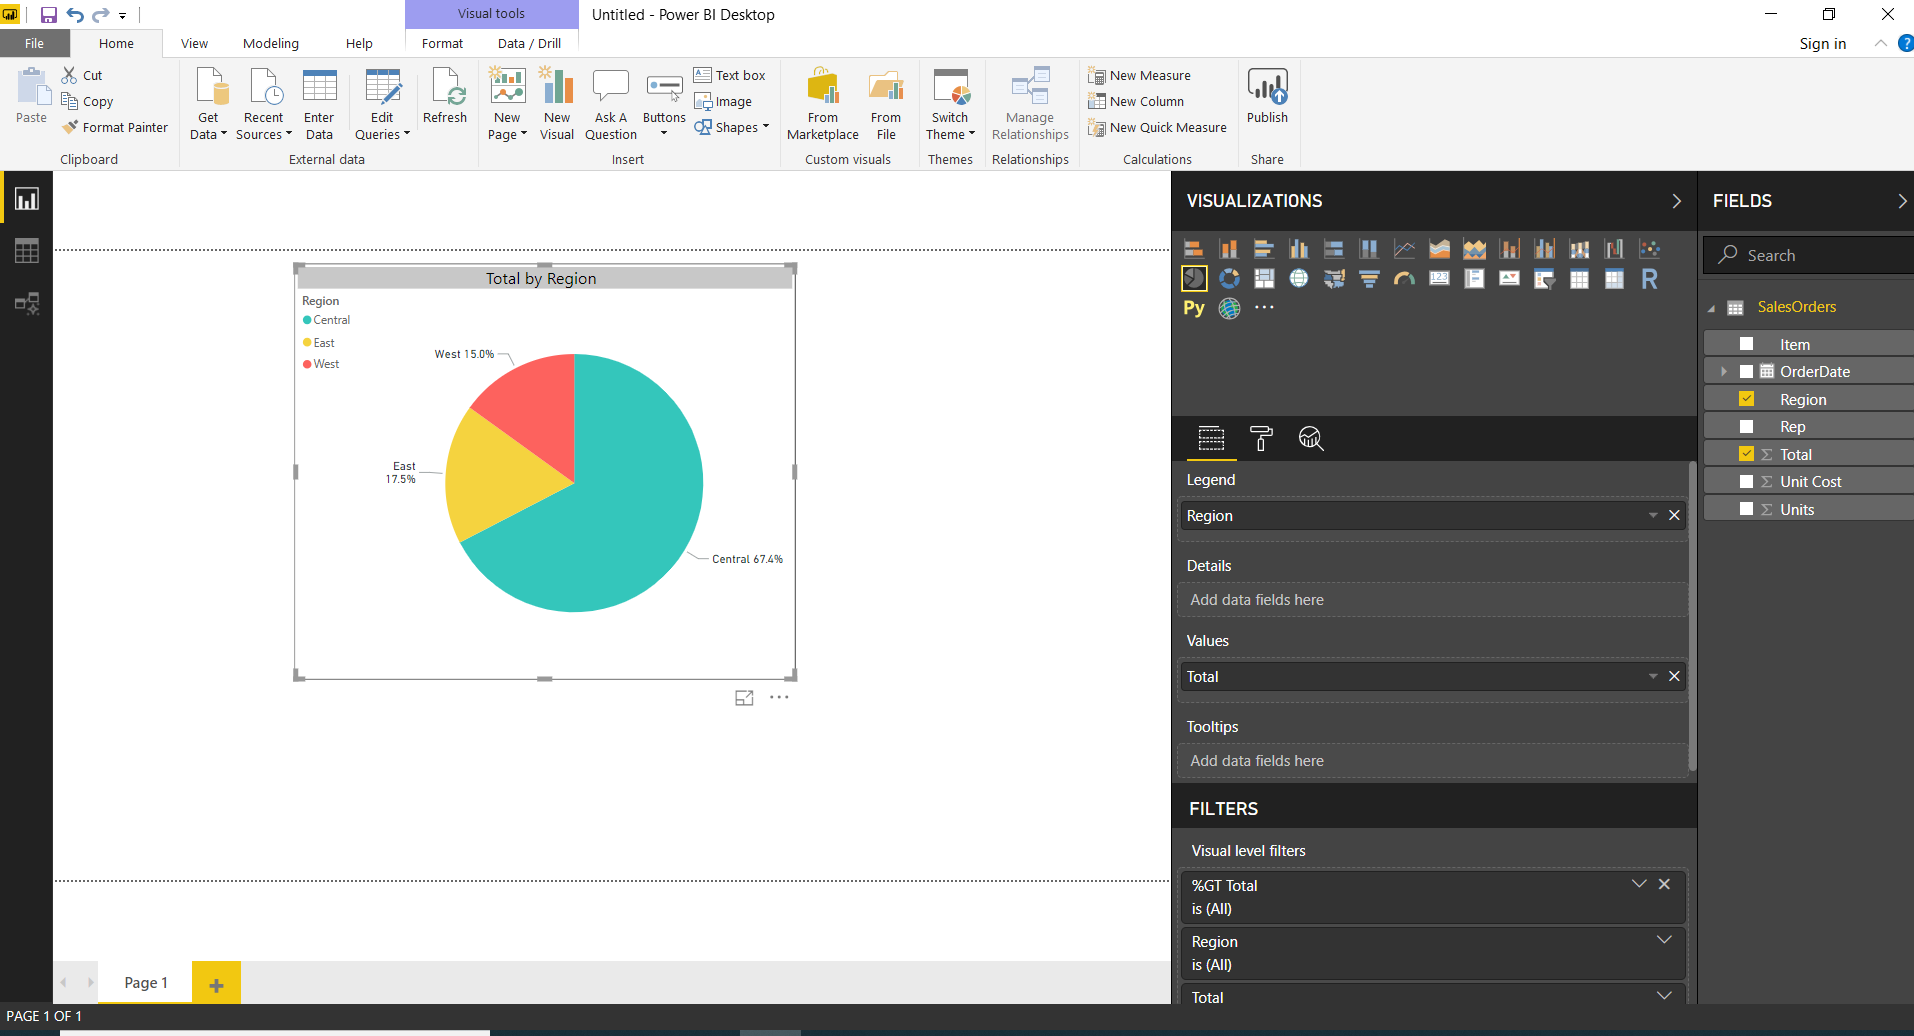
You can adjust the properties of the visualization like legend, values, formats, font, color, size, background, title, filters, etc. Power BI Desktop is loaded with tools and gives you complete freedom to create a visualization or report as you like.
4. Creating reports
Power BI Desktop offers the perfect set of tools to create informative and attractive reports. A report is a collection of visualizations that together give an informative account and insight on the imported data. A report in Power BI Desktop can consist of one or more than one pages.
You can use any and as many visualizations as you want to create a report. There is a range of options and tools such as buttons, themes, get data from marketplace, a new measure, a new column, refresh data, shapes, images, inline data, etc. using which you can make attractive reports.
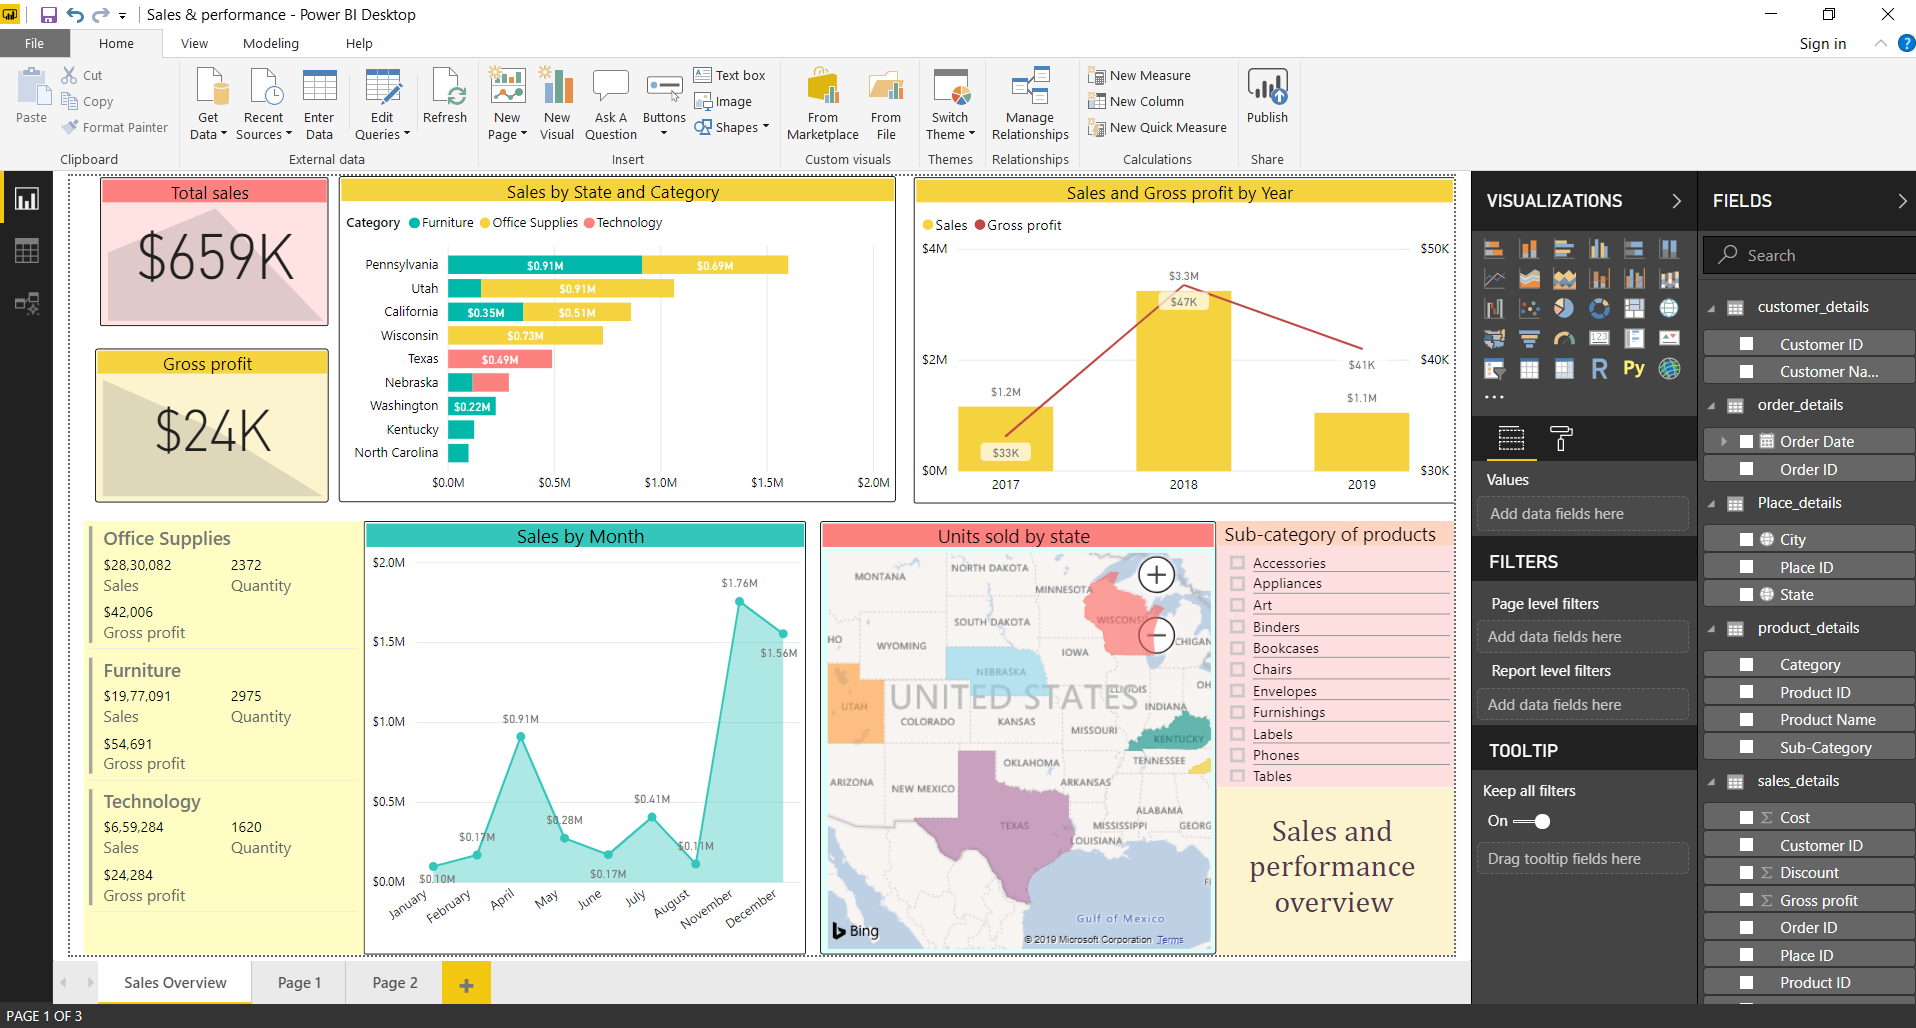
5. Sharing reports
Now, once you have created a report in Power BI Desktop, you can use the Publish option to share it with others. Publishing a report to Power BI Service having Power BI license is necessary. You can share the report at any location of Power BI Service such as your personal workspace, team workspace, or elsewhere.
Explore the concept of Custom Visuals in Power BI
Features of Power BI Desktop (April 2019)
The latest version of Power BI Desktop is the April 2019 version. In this section, we have enlisted some of the key new features added in this version.
- Added features in filter pane like full pane editing, renaming filters, filter pane scaling, conditional formatting for visual titles and for web URL action of buttons, shapes, images, etc.
- Some features for analytics such as drill through for access reports, continuous analysis for numeric targets, generally available Python support, and partial synonym matching in Q&A.
- There is a new DAX function, ALLCROSSFILTERED for data modeling.
- A new visualization called “Rainbow Gauge” is available.
- New data connectors are added such as Power BI dataflow connector, Oracle Essbase connector, PDF connector, Web By Example connector, Intersystems IRIS connector, Indexima connector, Luminis InformationGrid connector, Solver BI360, and Paxata data connector.
- A Power BI Paginated Report Builder is also added in the new version.
Summary
This concludes our tutorial on Power BI Desktop. Here, we learned the basics of Power BI Desktop. We also had detailed learning on what Power BI Desktop has to offer to its users in terms of functionalities and uses. We hope our explanation was helpful enough to provide you a good kickstart in working with Power BI Desktop.
Don’t forget to check out the most asked questions in Power Bi Interview
You give me 15 seconds I promise you best tutorials
Please share your happy experience on Google


Helpful article.
Awesome content. I’m glad to be here.
Thank you so much for your hard work